Fig. 3
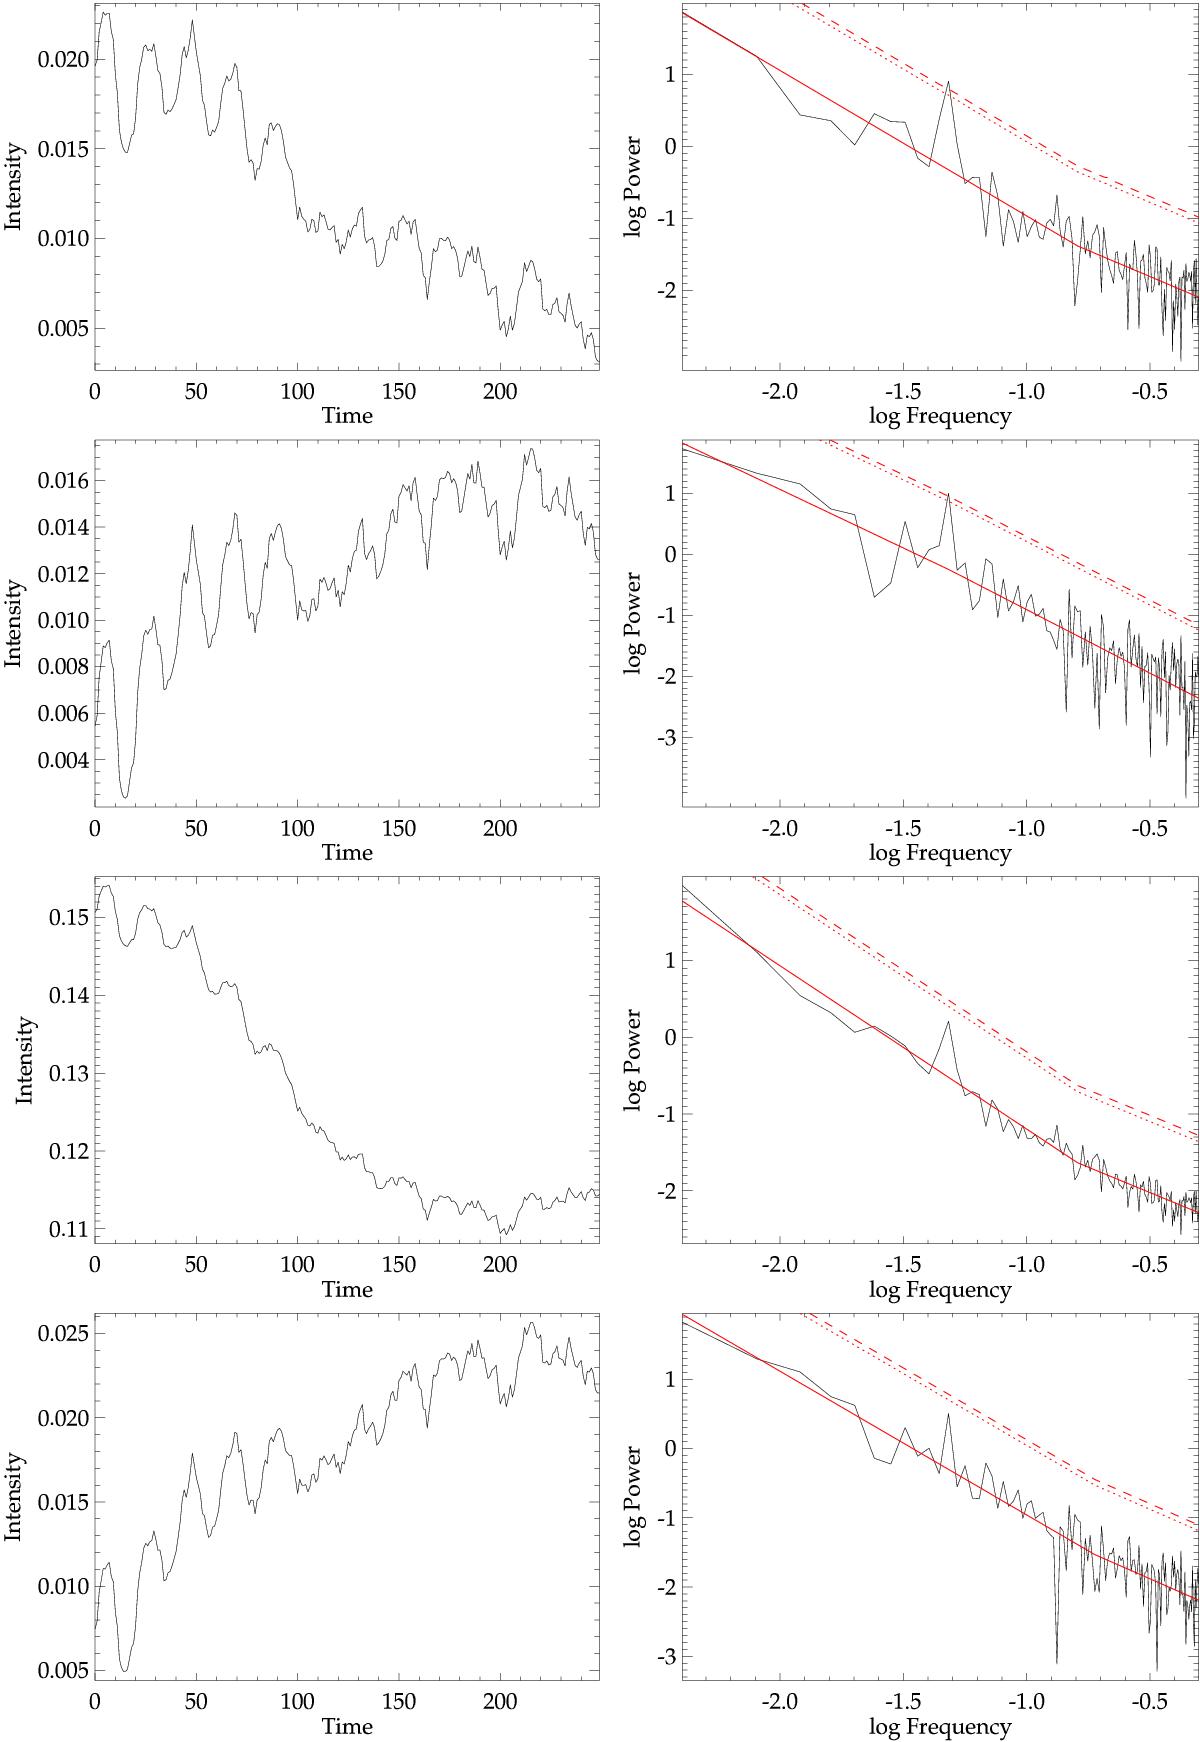
Examples of synthetic flare time series with QPPs are given on the left, and on the right are the corresponding power spectra, where the red solid line is a power law fit, and the red dotted and dashed lines correspond to the 95% and 99% confidence levels respectively. The top two rows show two signals with different background trends, both with a peak above the 99% level in the power spectrum. The bottom two rows show the same signals but with steeper background trends, the result of which is that the peaks no longer reach significant levels in the power spectra.
Current usage metrics show cumulative count of Article Views (full-text article views including HTML views, PDF and ePub downloads, according to the available data) and Abstracts Views on Vision4Press platform.
Data correspond to usage on the plateform after 2015. The current usage metrics is available 48-96 hours after online publication and is updated daily on week days.
Initial download of the metrics may take a while.