Free Access
Fig. 1
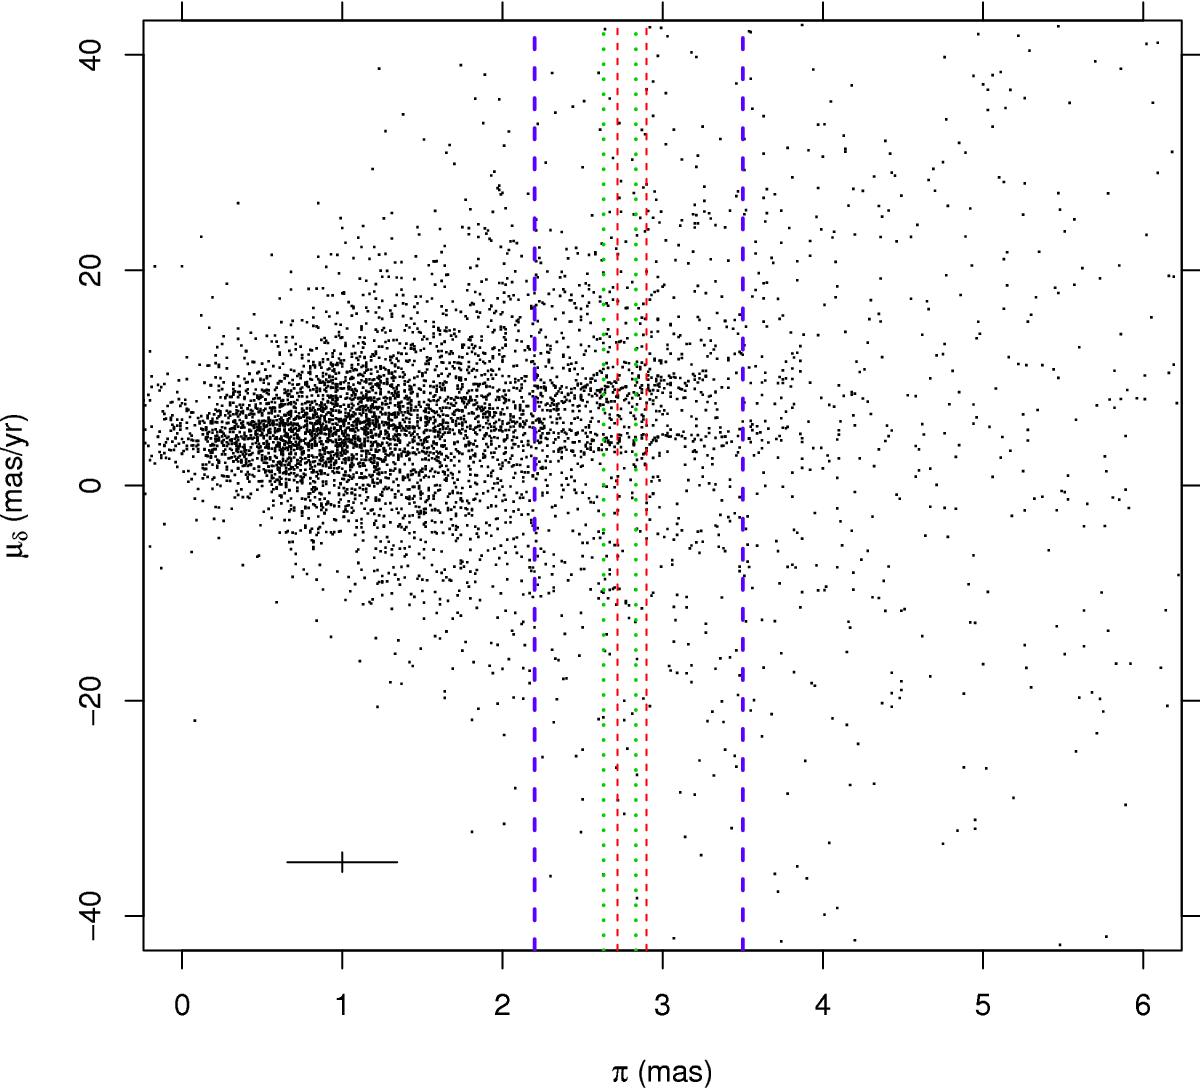
Proper motion along Declination μδ vs. parallax π for the entire Vela OB2 TGAS sample. Vertical lines correspond to literature distances for γ2 Vel (red) and NGC 2547 (green), and to our sample selection (blue). The average errors for the parallax-selected sample are shown.
Current usage metrics show cumulative count of Article Views (full-text article views including HTML views, PDF and ePub downloads, according to the available data) and Abstracts Views on Vision4Press platform.
Data correspond to usage on the plateform after 2015. The current usage metrics is available 48-96 hours after online publication and is updated daily on week days.
Initial download of the metrics may take a while.