Free Access
Fig. 4
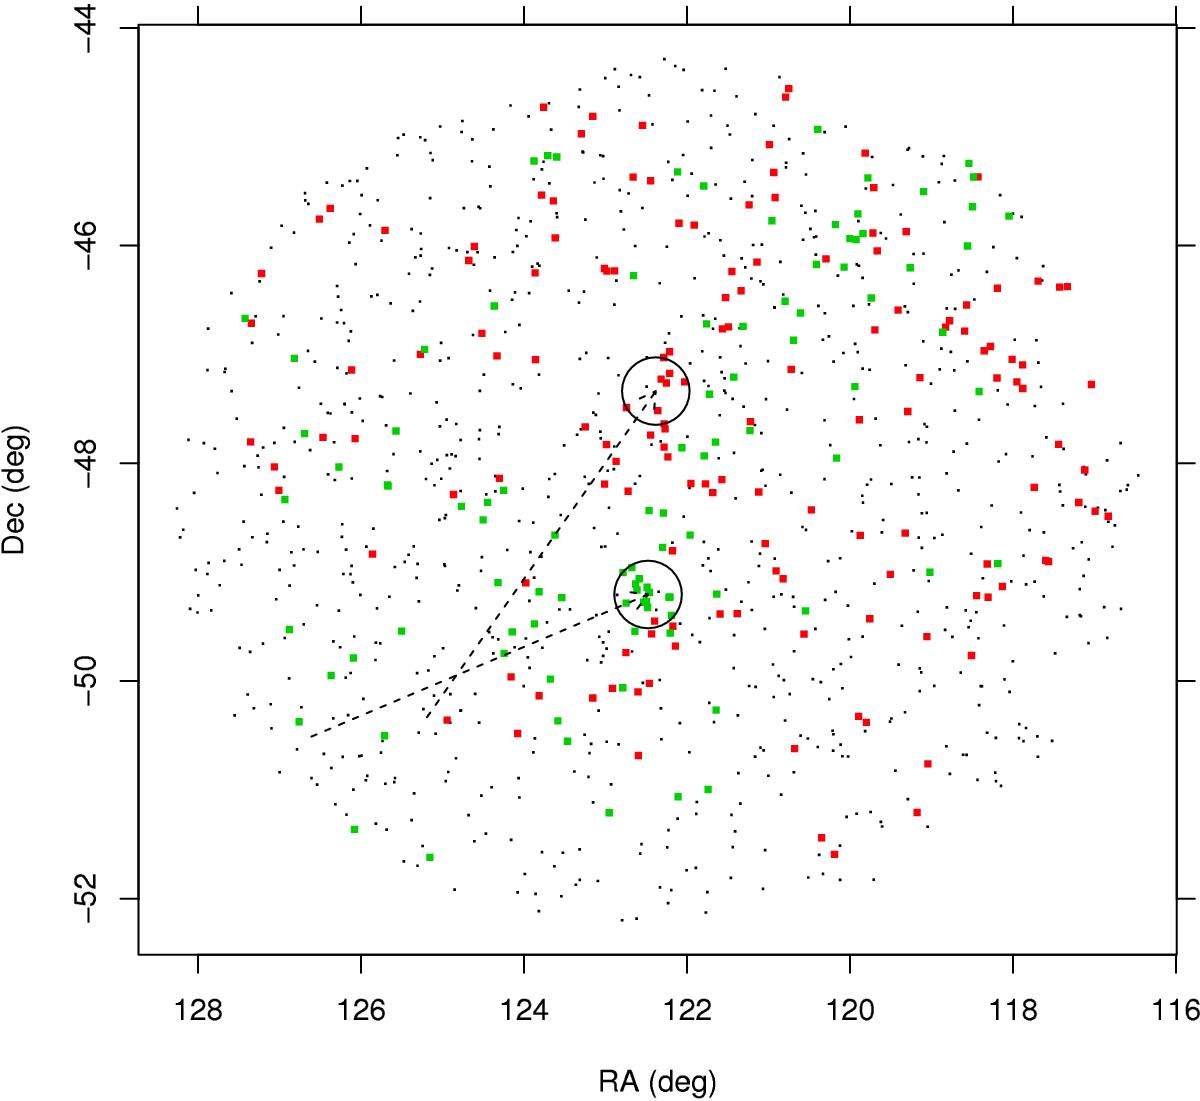
Spatial distributions of kinematical populations C and D (red and green, respectively). The small black dots indicate the datapoints outside of rectangles in Fig. 2. The big circles indicate positions of γ2 Vel (north) and NGC 2547 (south). The dashed arrows indicate their inferred positions 1.1 Myr ago.
Current usage metrics show cumulative count of Article Views (full-text article views including HTML views, PDF and ePub downloads, according to the available data) and Abstracts Views on Vision4Press platform.
Data correspond to usage on the plateform after 2015. The current usage metrics is available 48-96 hours after online publication and is updated daily on week days.
Initial download of the metrics may take a while.