Fig. 13
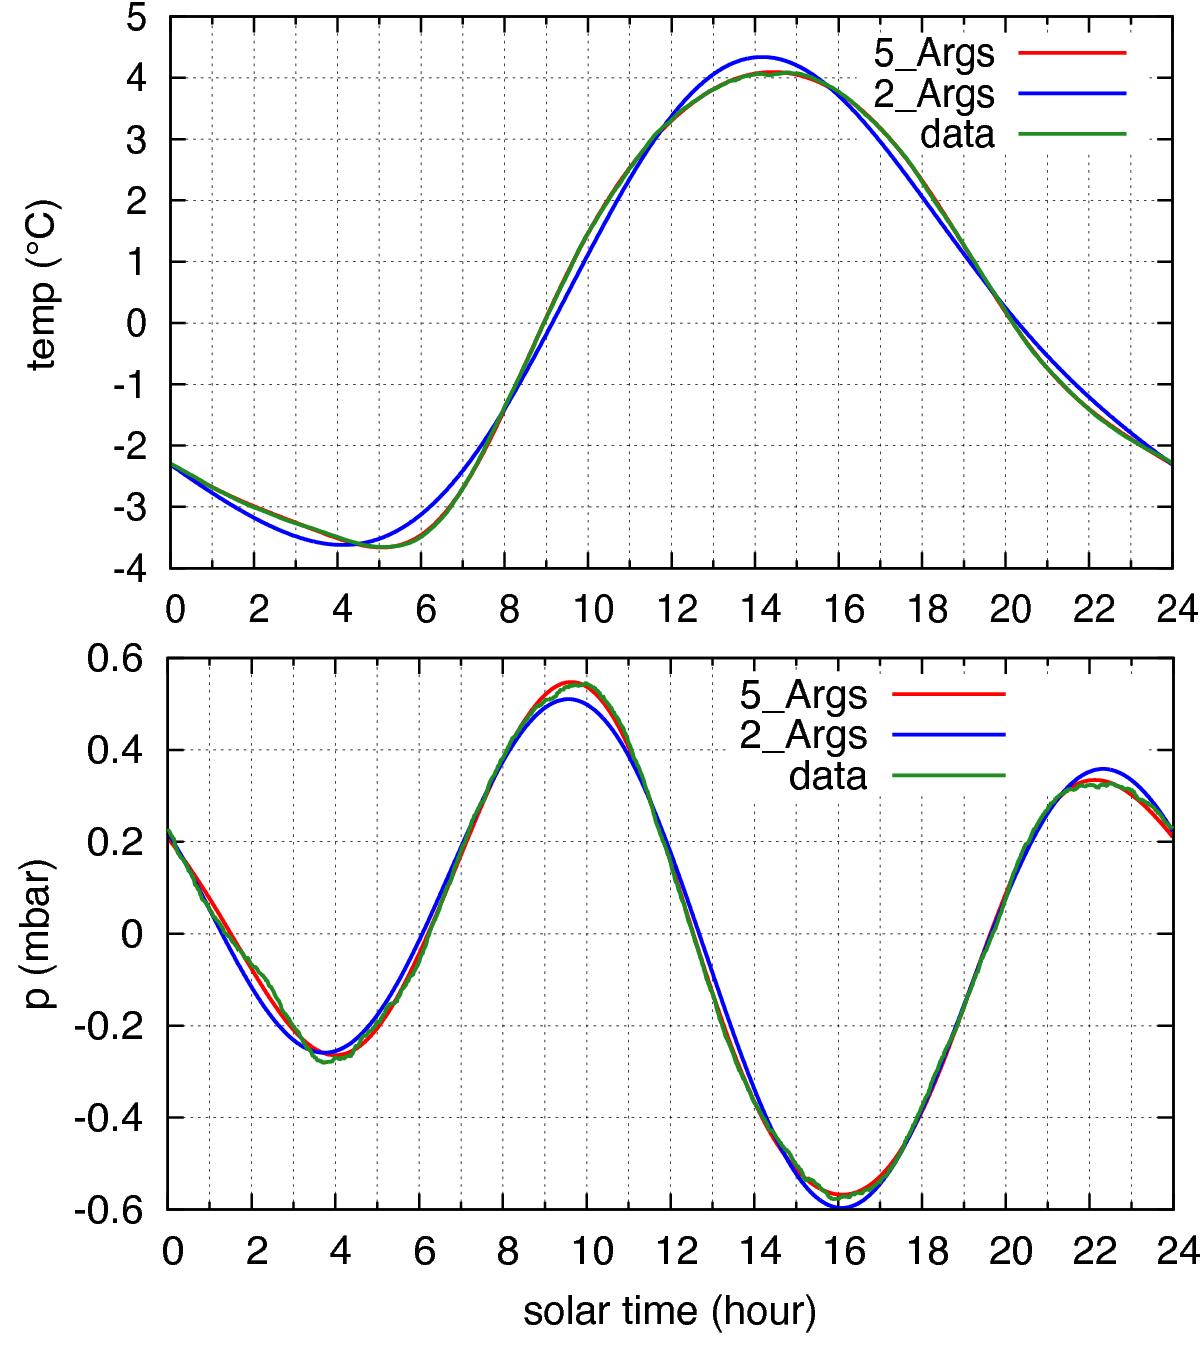
Average daily variation in temperature in degrees (top) and pressure in mbar (bottom) over one year, plotted over solar time (in hours), the subsolar point corresponding to 12 h. The data was recorded every minute over the full year 2013 with a Vantage Pro 2 weather station at latitude 48.363°N. The time is converted to solar time and the data averaged over an exact count of 365 days. The average values of temperature (10.8973° C) and pressure (1015.83 mbar) have been removed to display only the variable part. In both figures, the raw data (in green) has been decomposed in a Fourier series over the 24 h period, limited to two harmonics (blue), or five harmonics (red). Temperature is dominated by the diurnal component, with a maximum value around 14h26mn. The largest harmonics of the pressure variations is the semidiurnal term, followed by the diurnal term. Two pressure maxima can be observed, at 9h38mn and 22h07mn.
Current usage metrics show cumulative count of Article Views (full-text article views including HTML views, PDF and ePub downloads, according to the available data) and Abstracts Views on Vision4Press platform.
Data correspond to usage on the plateform after 2015. The current usage metrics is available 48-96 hours after online publication and is updated daily on week days.
Initial download of the metrics may take a while.