Fig. C.1
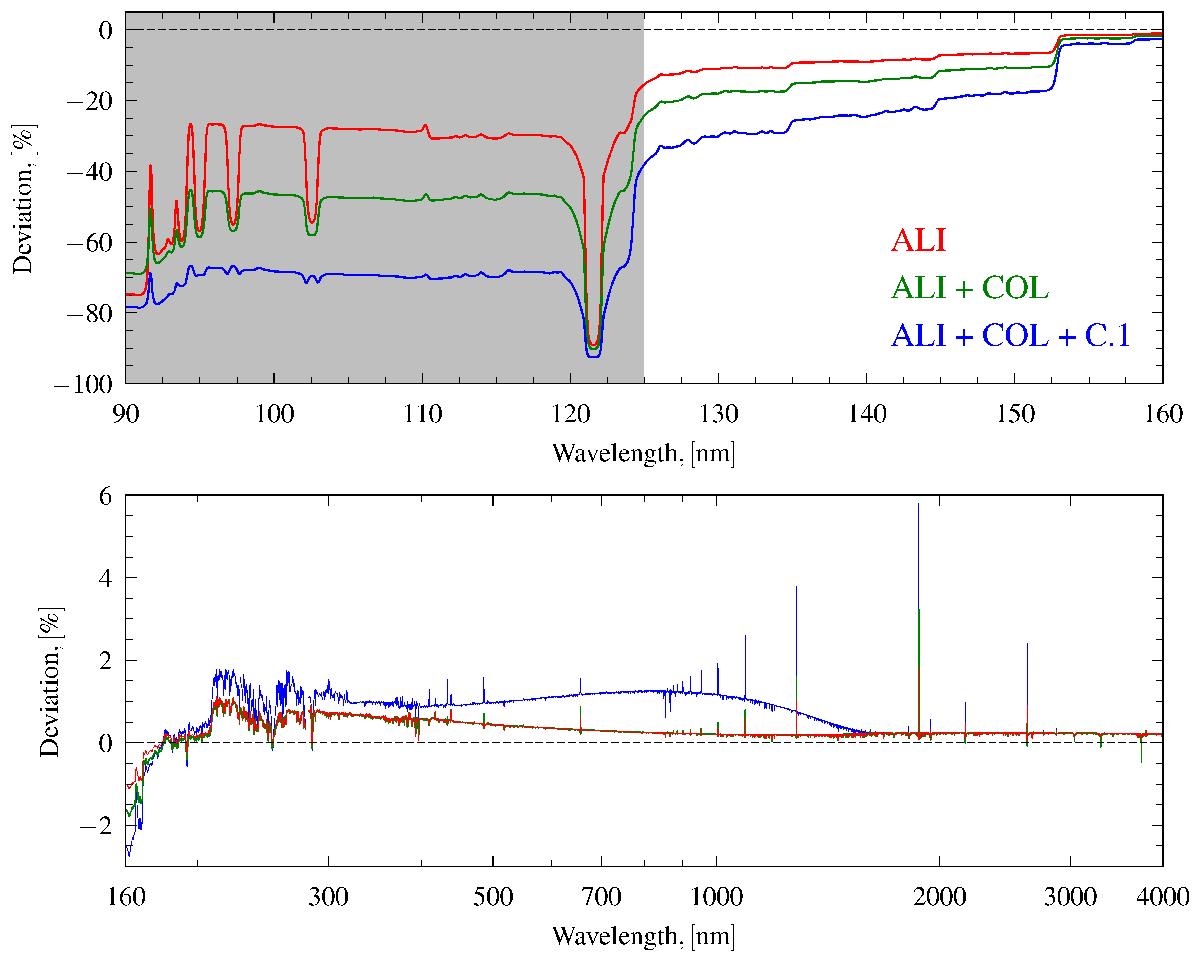
Relative deviation of the NESSY spectrum from the one calculated with COSI. COSI spectrum is available only from 90 nm onward. (NESSY − COSI)/COSI ratio is shown for the three consecutive changes in the code that had the largest impact on the resulting spectrum: the update of ALI-scheme (ALI), implementation of the new hydrogen collision coefficients (ALI + COL) according to Johnson (1972) and the correction of an error in the treatment of the reaction (C.1)(ALI + COL + C.1). All spectra have been calculated using the FAL99-C model of solar atmosphere (Fontenla et al. 1999) and smoothed with the ATLAS3 Gaussian (see Sect. 4) on a 0.5 Å resolution grid. The shaded part of the spectrum was not published by S2010. Note the logarithmic scale of the x-axis in the bottom panel.
Current usage metrics show cumulative count of Article Views (full-text article views including HTML views, PDF and ePub downloads, according to the available data) and Abstracts Views on Vision4Press platform.
Data correspond to usage on the plateform after 2015. The current usage metrics is available 48-96 hours after online publication and is updated daily on week days.
Initial download of the metrics may take a while.