Fig. 8
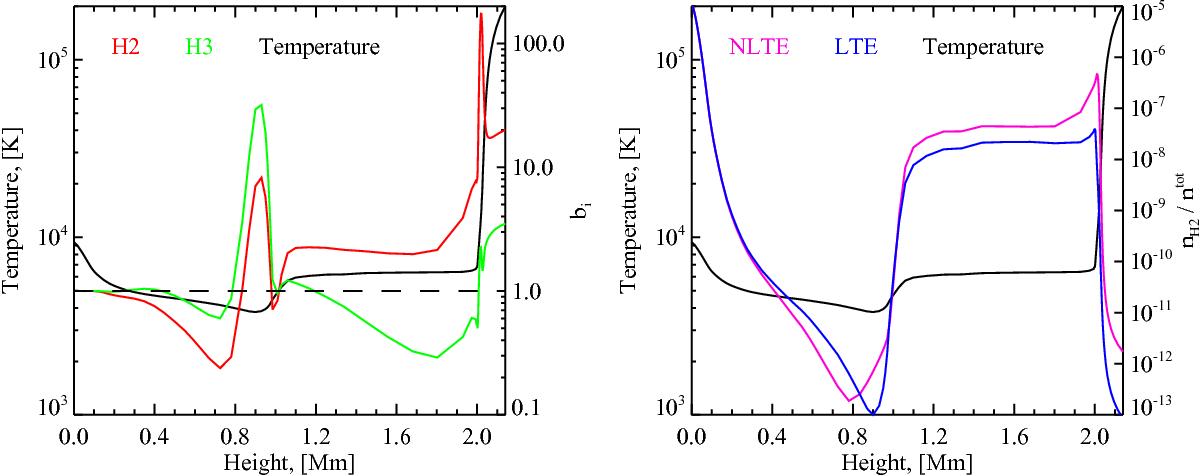
Left panel: NLTE departure coefficients (see Sect. 3.3) for the second and third hydrogen levels calculated with NESSY for the FCHHT-B solar atmosphere model (Fontenla et al. 2009). Right panel: second hydrogen level population in LTE and NLTE cases expressed in terms of the ratio to the total number density. The black curve, corresponding to the left y-axis in both panels, shows the FCHHT-B temperature profile.
Current usage metrics show cumulative count of Article Views (full-text article views including HTML views, PDF and ePub downloads, according to the available data) and Abstracts Views on Vision4Press platform.
Data correspond to usage on the plateform after 2015. The current usage metrics is available 48-96 hours after online publication and is updated daily on week days.
Initial download of the metrics may take a while.