Fig. 9
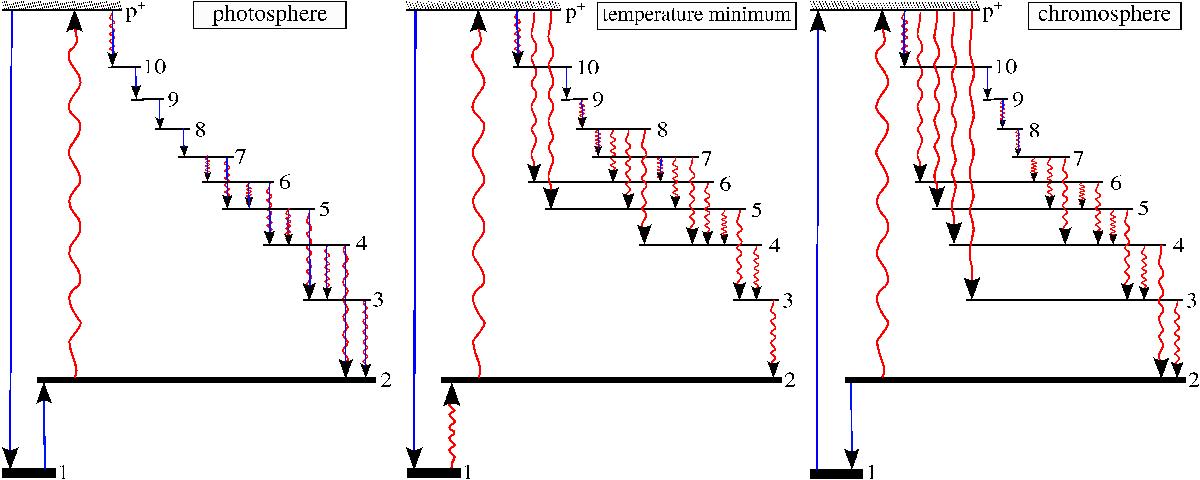
Main processes (according to NESSY calculations) contributing to the statistical balance of hydrogen levels in photosphere, temperature minimum and chromosphere. Each arrow corresponds to a net rate. Wavy red arrows are transitions dominated by radiation, straight blue arrows are collisionally dominated transitions. Mixed arrows indicate a significant contribution both from collisions and radiation either everywhere in the region or in a part of it.
Current usage metrics show cumulative count of Article Views (full-text article views including HTML views, PDF and ePub downloads, according to the available data) and Abstracts Views on Vision4Press platform.
Data correspond to usage on the plateform after 2015. The current usage metrics is available 48-96 hours after online publication and is updated daily on week days.
Initial download of the metrics may take a while.