Free Access
Fig. 1
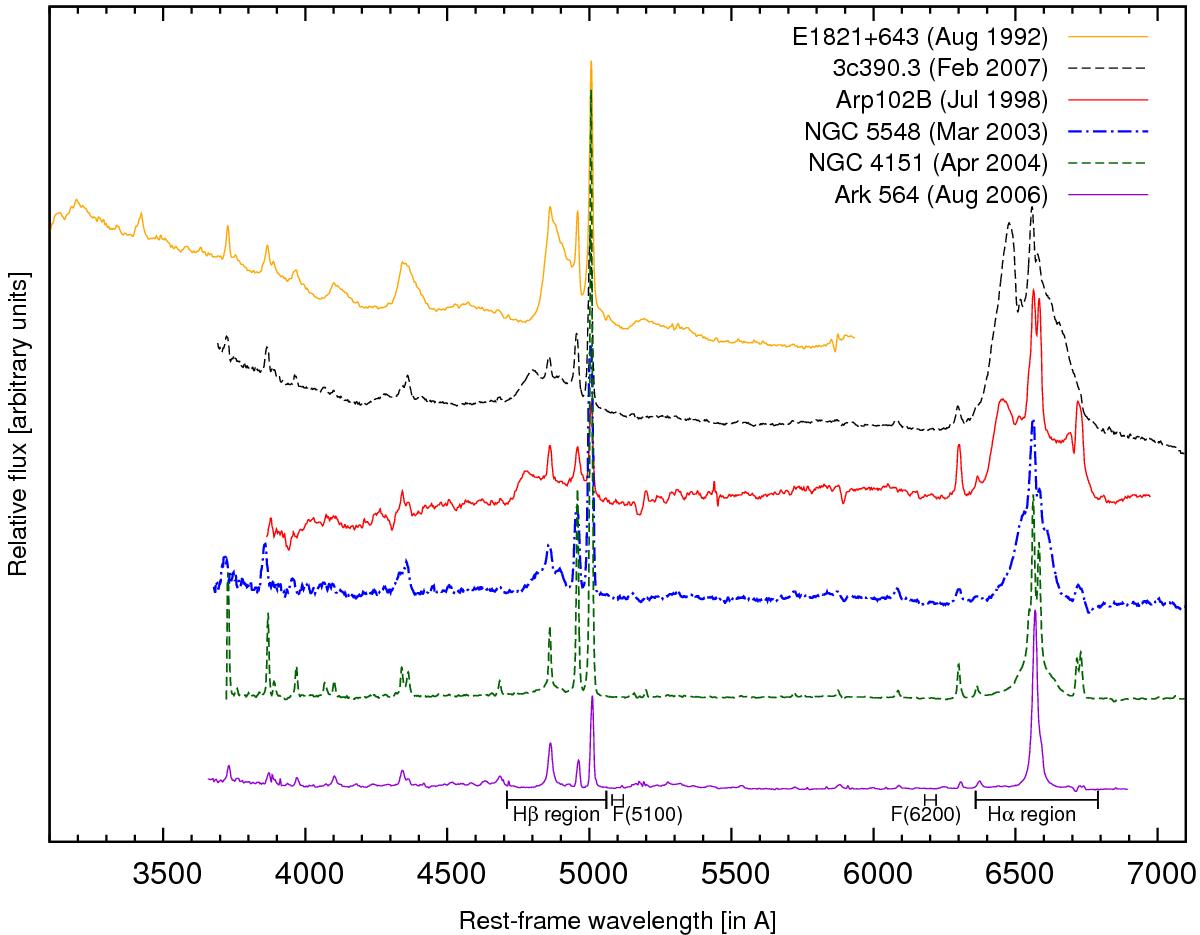
Spectra of six studied objects (as listed in top right corner, object name and observation epoch are given). Intensity is given in arbitrary units shown for comparison. The measured continuum and line extraction bands are marked below the first spectrum.
Current usage metrics show cumulative count of Article Views (full-text article views including HTML views, PDF and ePub downloads, according to the available data) and Abstracts Views on Vision4Press platform.
Data correspond to usage on the plateform after 2015. The current usage metrics is available 48-96 hours after online publication and is updated daily on week days.
Initial download of the metrics may take a while.