Fig. 4
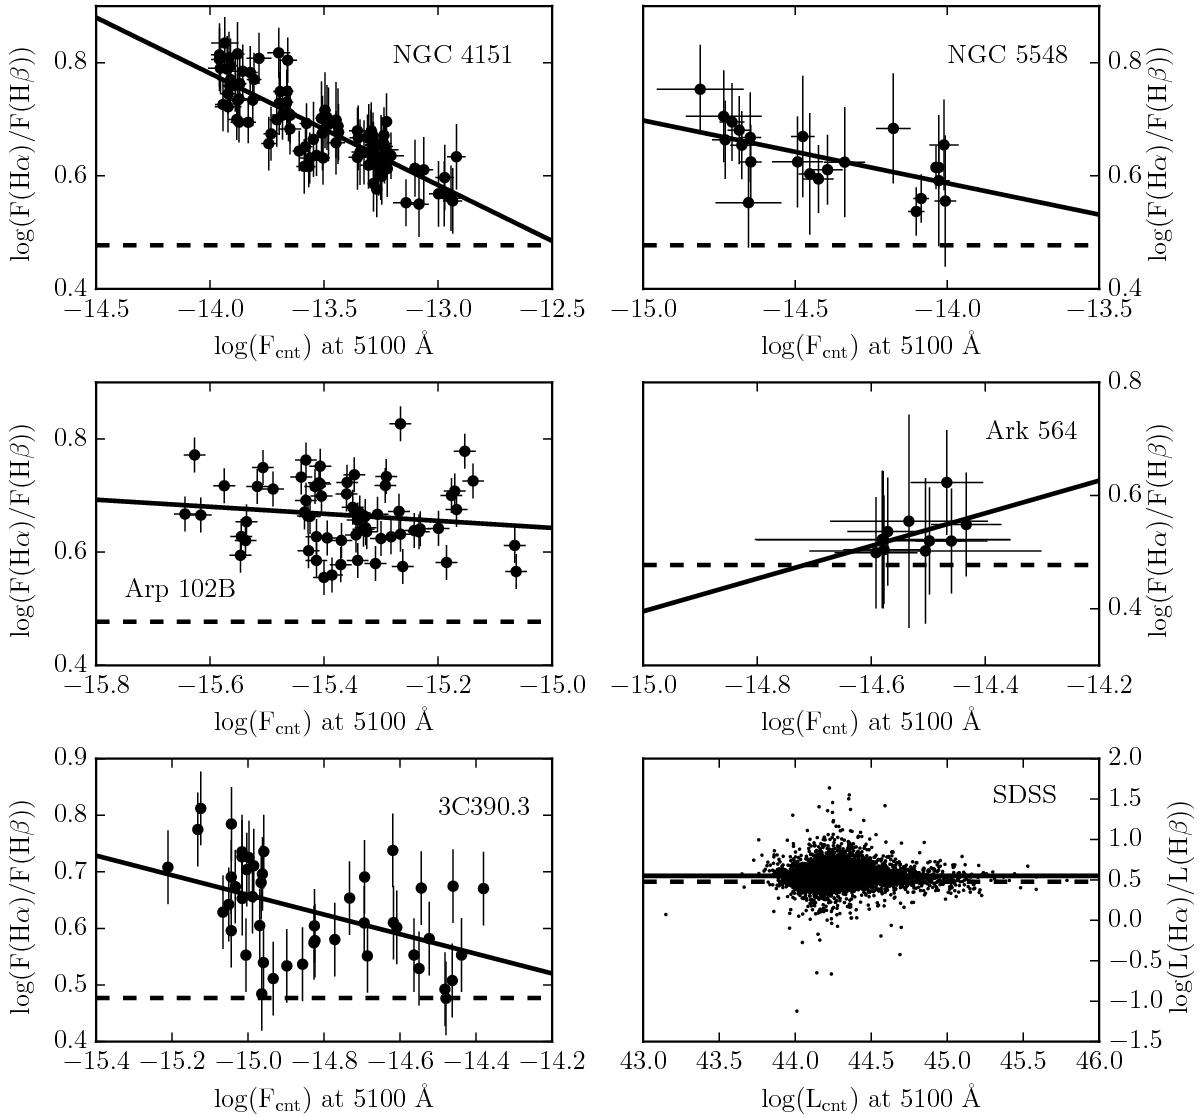
Hα/Hβ flux ratio vs. the continuum flux at 5100 Å in logarithm scale, for the five AGNs in our sample for which both Hα and Hβ fluxes are available (name denoted on each plot), and for a sample of 4800 SDSS AGNs from Shen et al. (2011; bottom right panel). The solid line represents the best fit of the observed data and the dashed line represents the typical ratio Hα/Hβ ≈ 3 expected in the case of pure photoionization.
Current usage metrics show cumulative count of Article Views (full-text article views including HTML views, PDF and ePub downloads, according to the available data) and Abstracts Views on Vision4Press platform.
Data correspond to usage on the plateform after 2015. The current usage metrics is available 48-96 hours after online publication and is updated daily on week days.
Initial download of the metrics may take a while.