Free Access
Fig. 8
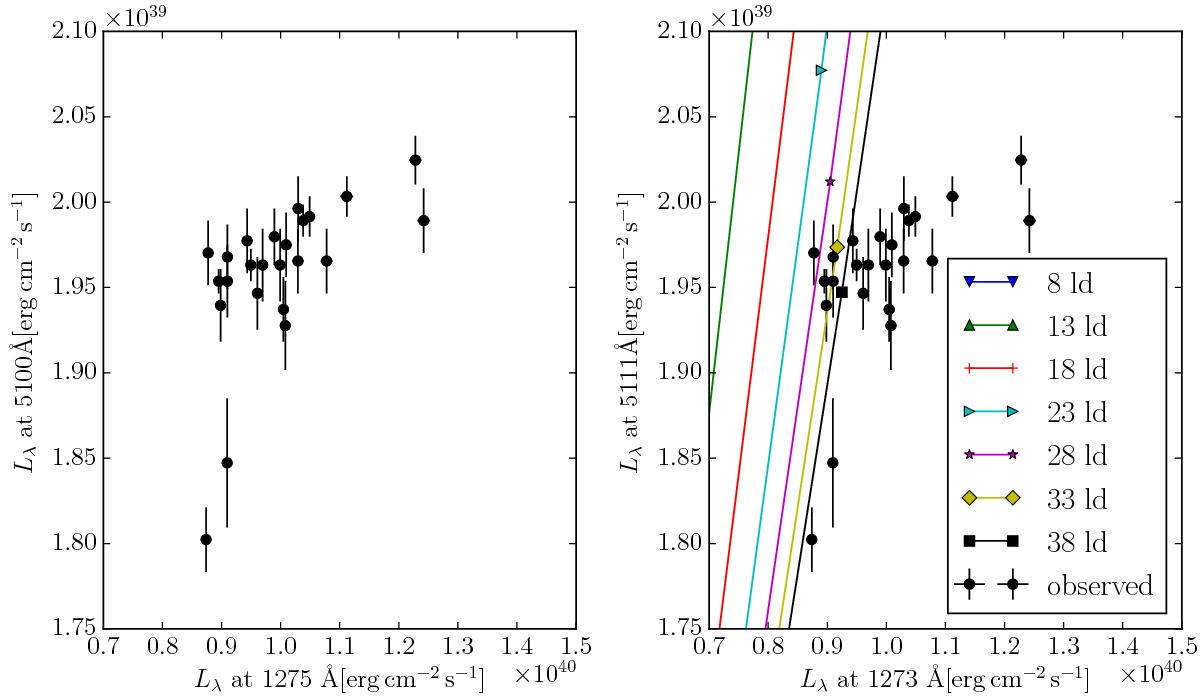
Left: observed continuum flux at 1275 Å vs. the flux at 5100 Å for NGC 4151 obtained during short-time period (see text for details). Right: modeled continuum flux at 1275 Å vs. the flux at 5100 Å (solid lines for different RBLR sizes, denoted in the bottom left) compared to the observed values (full circles).
Current usage metrics show cumulative count of Article Views (full-text article views including HTML views, PDF and ePub downloads, according to the available data) and Abstracts Views on Vision4Press platform.
Data correspond to usage on the plateform after 2015. The current usage metrics is available 48-96 hours after online publication and is updated daily on week days.
Initial download of the metrics may take a while.