Fig. 18
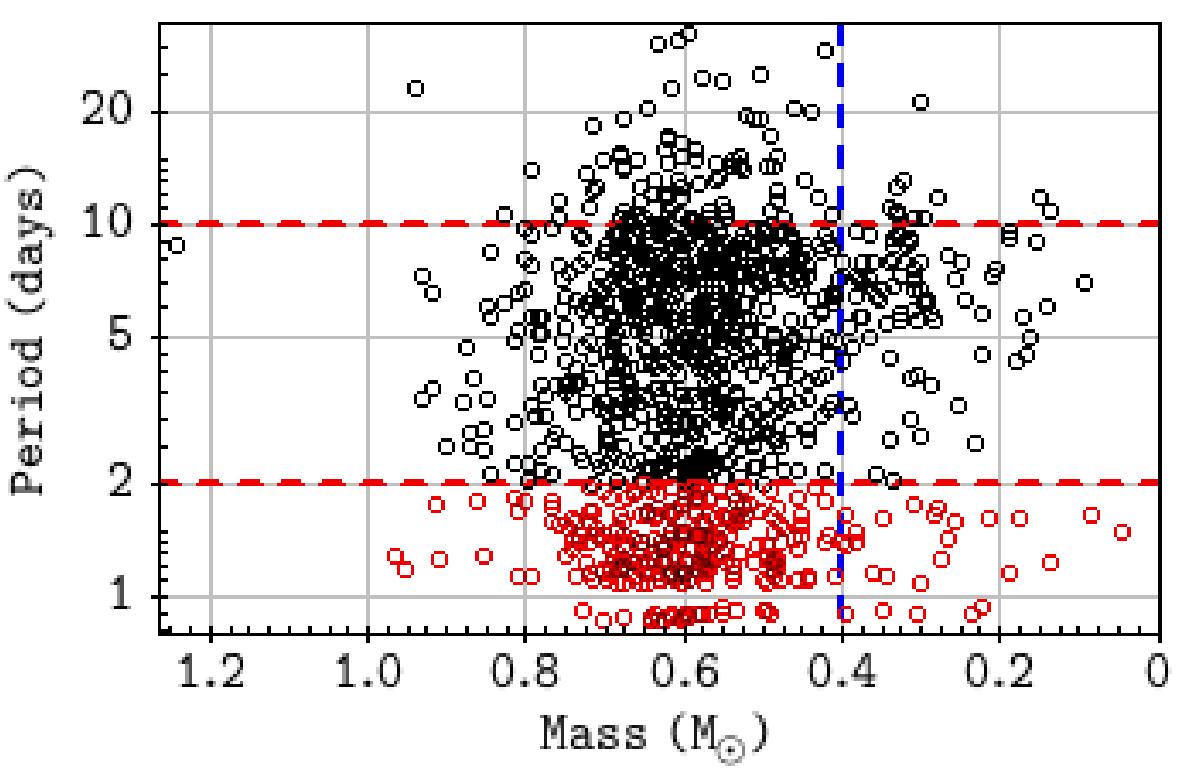
Mass vs. period distribution for periodic candidate members of CygOB2. Stars with reliable periods (P ≥ 2 days) are shown as black circles, and stars with dubious periods (P< 2 days) are shown as red circles. Dashed red lines delimit for periods equal to 2 and 10 days. The blue dashed line indicates the limit between the mass bins analyzed in the present section.
Current usage metrics show cumulative count of Article Views (full-text article views including HTML views, PDF and ePub downloads, according to the available data) and Abstracts Views on Vision4Press platform.
Data correspond to usage on the plateform after 2015. The current usage metrics is available 48-96 hours after online publication and is updated daily on week days.
Initial download of the metrics may take a while.