Free Access
Fig. 3
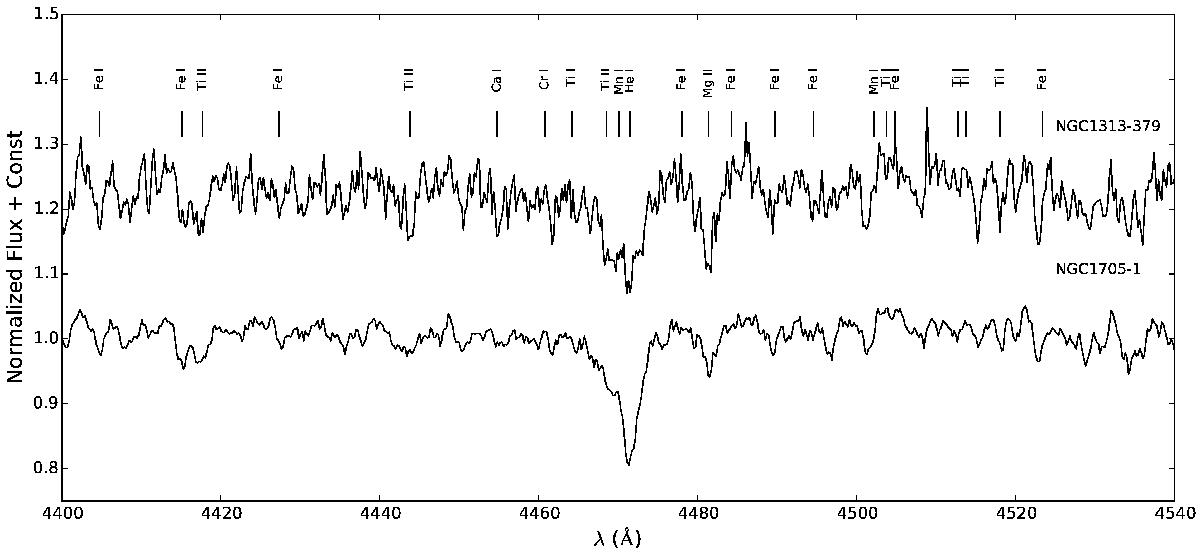
Sections of the spectra from each of the YMCs analysed in this work. The spectra are normalised to an average continuum level of 1.0, and a constant offset has been added for the benefit of visualisation.
Current usage metrics show cumulative count of Article Views (full-text article views including HTML views, PDF and ePub downloads, according to the available data) and Abstracts Views on Vision4Press platform.
Data correspond to usage on the plateform after 2015. The current usage metrics is available 48-96 hours after online publication and is updated daily on week days.
Initial download of the metrics may take a while.