Fig. 6
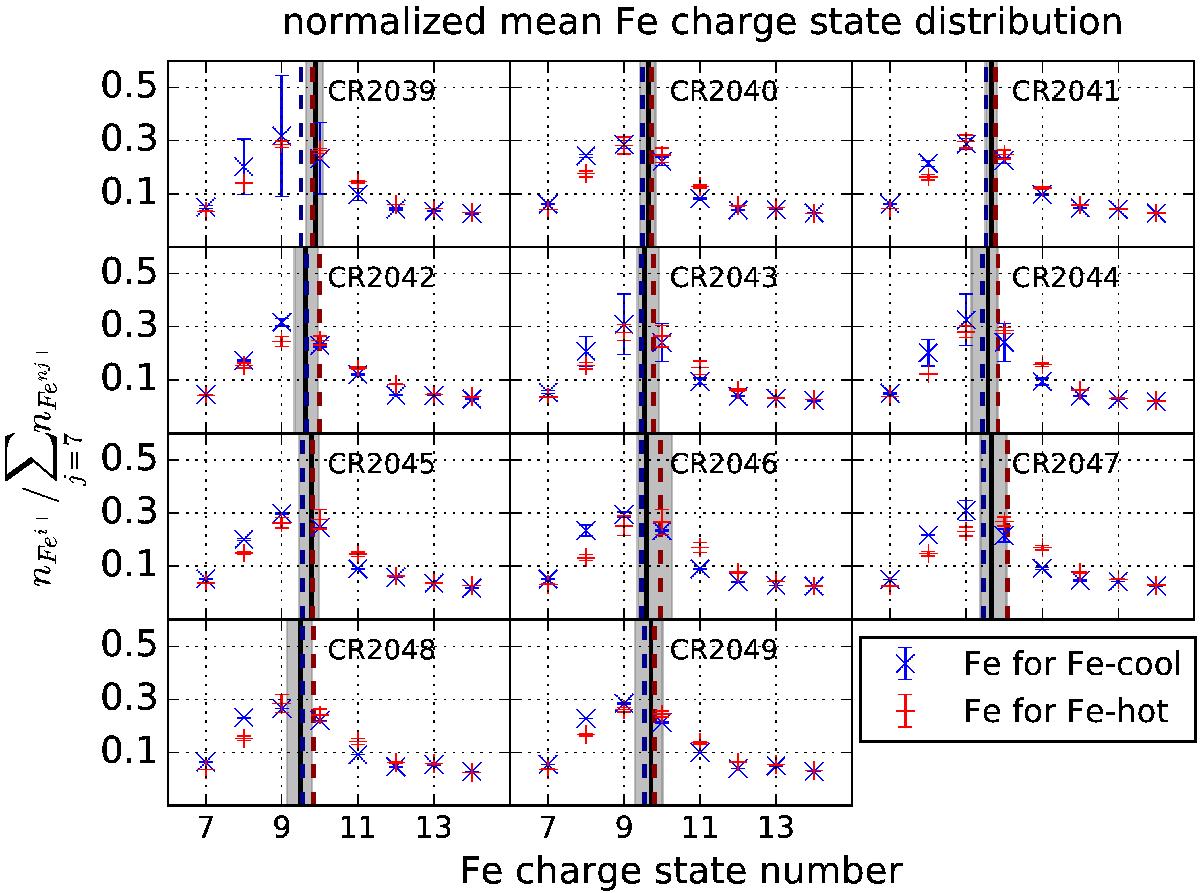
Normalized mean charge distributions for Fe sorted by CR (in the same order as in Fig. 1) averaged separately over the Fe-hot and Fe-cool parts of the first recurring coronal hole stream during CR 2030-2049. CR 2050 is omitted because the coronal hole wind stream is not observed any more in that CR. The black vertical line marks the median of the average Fe charge state for each CR as given in Fig. 4 and the gray shaded areas indicate the corresponding 1σ interval. The median of the average Fe charge state in Fe-hot is indicated by a red dashed vertical line and the median of the average Fe charge state in Fe-cool coronal hole wind is given in blue. The error bars indicate the error of the mean. In the cases where the error bars are not visible, they are hidden behind the respective symbol for the mean. Each distribution is normalized to its sum.
Current usage metrics show cumulative count of Article Views (full-text article views including HTML views, PDF and ePub downloads, according to the available data) and Abstracts Views on Vision4Press platform.
Data correspond to usage on the plateform after 2015. The current usage metrics is available 48-96 hours after online publication and is updated daily on week days.
Initial download of the metrics may take a while.