Fig. 1
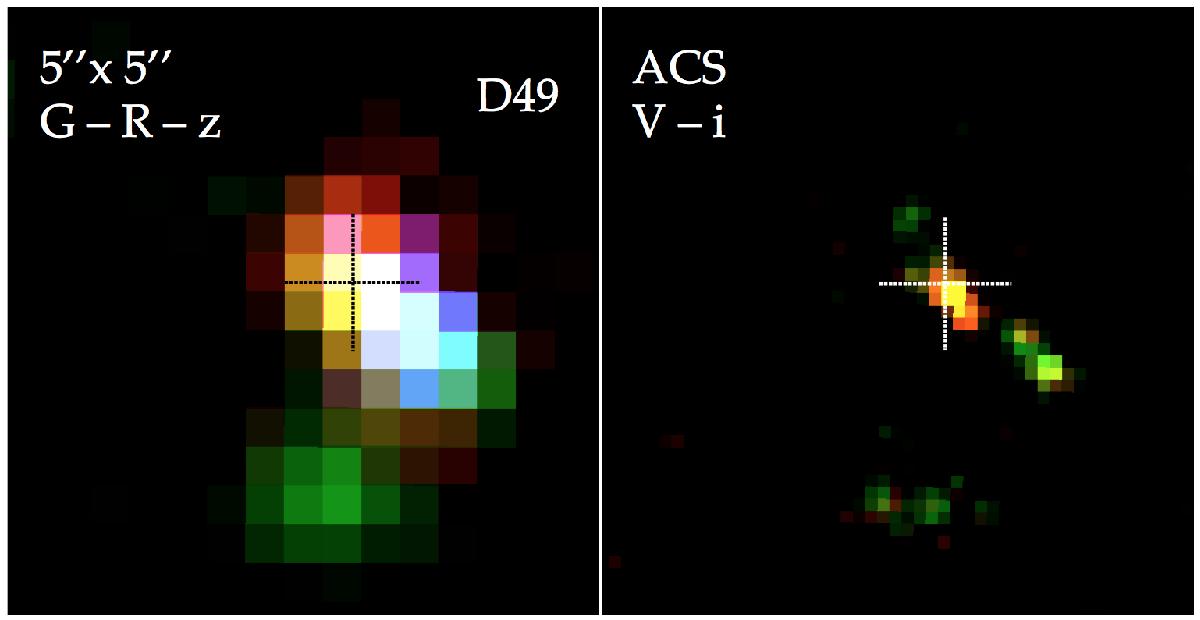
Left: G−R−z, three colour image of D49, as obtained by ground based imaging. There is a clear colour gradient with CO emission centered at the position of the red component. Right: V−i, high-resolution two colour image obtained by ACS/HST. The system is resolved into two components (a red and a blue), separated by ~1′′. The cross (and its size) in each panel depicts the centroid (and the position uncertainty) of the line emission detected by PdBI.
Current usage metrics show cumulative count of Article Views (full-text article views including HTML views, PDF and ePub downloads, according to the available data) and Abstracts Views on Vision4Press platform.
Data correspond to usage on the plateform after 2015. The current usage metrics is available 48-96 hours after online publication and is updated daily on week days.
Initial download of the metrics may take a while.