Fig. 3
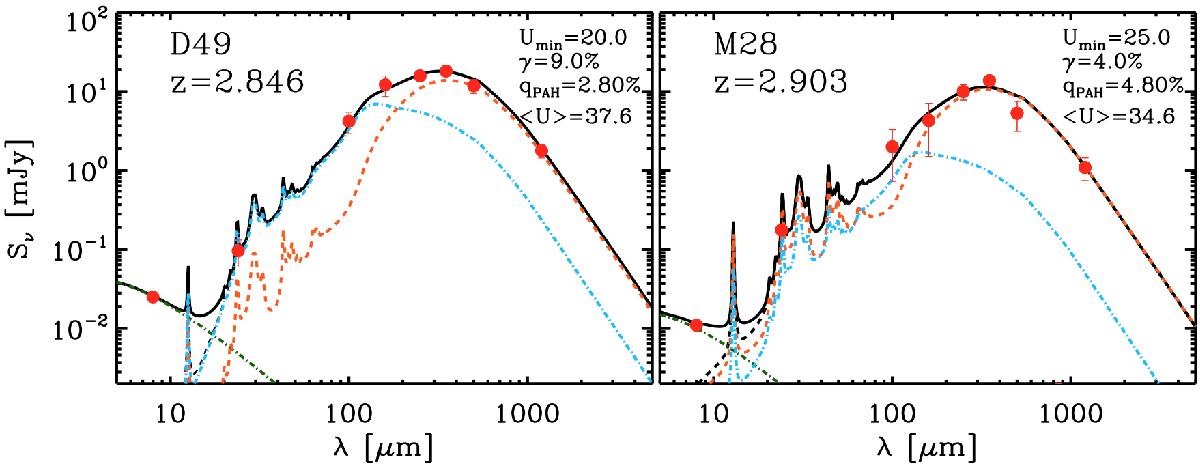
Spectral energy distributions (observed frame) of D49 and M28, including IRAC 8 μm, MIPS 24 μm PACS 100, 160 μm and SPIRE 250, 350, and 500 μm and MAMBO 1.2 mm data points (red dots). The observed data are overlaid with the best-fit DL07 model (black line). The “PDR” and diffuse ISM components are shown in cyan and orange, respectively, while the stellar component is depicted with a green dashed-dotted line. On the top right of each panel we list the derived parameters from the SED modeling, including Umin (radiation field of the diffuse ISM), γ (the contribution of the PDR component in the total SED), qPAH (the fraction of dust in PAHs) and ⟨ U ⟩ (mean radiation field).
Current usage metrics show cumulative count of Article Views (full-text article views including HTML views, PDF and ePub downloads, according to the available data) and Abstracts Views on Vision4Press platform.
Data correspond to usage on the plateform after 2015. The current usage metrics is available 48-96 hours after online publication and is updated daily on week days.
Initial download of the metrics may take a while.