Fig. 6
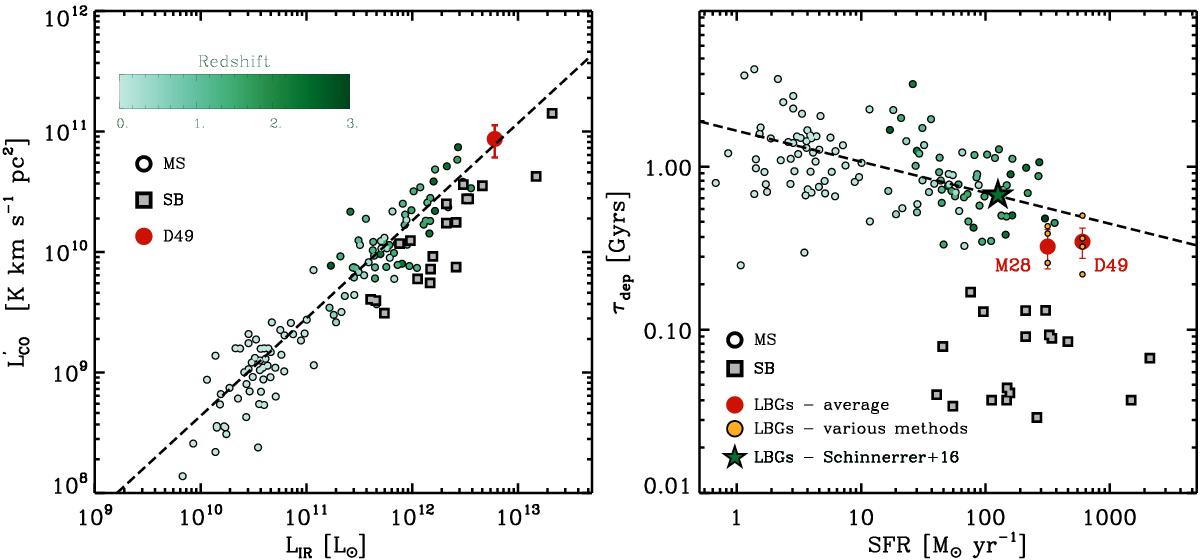
Left: integrated Schmidt-Kennicutt relation using direct observables. Green circles correspond to MS galaxies, colour coded according to their redshift. Grey squares correspond to local and high-z star-bursts galaxies (× 4 above the MS). The compilation of MS and SBs galaxies is presented in Sargent et al. (2014) and Silverman et al. (2016).The red dot depicts the position of D49, after converting the measured CO[J = 3 → 2] luminosity to CO[J = 1 → 0] assuming a line ratio of r3,1 = 0.5. The dashed line corresponds to the integrated Schmidt-Kennicutt relation of MS galaxies as derived by Sargent et al. (2014). Right: gas depletion time scale (τdep = MH2/SFR or 1/SFE), based on the average MH2 estimates from the various methods described in the text (filled red circles). The individual measurements based on various techniques and metallicity assumptions for each galaxy are depicted with orange circles. As in the left panel, literature MS galaxies are colour coded based on their redshift (see Sargent et al. 2014 for more details about the sample compilation). The dark green star corresponds to the average measurement reported by Schinnerer et al. (2016) for a sample of typical z ~ 3.2 LBGs, derived based on single mm band observations. The dashed line corresponds to the sequence of MS galaxies as derived by Sargent et al. (2014).
Current usage metrics show cumulative count of Article Views (full-text article views including HTML views, PDF and ePub downloads, according to the available data) and Abstracts Views on Vision4Press platform.
Data correspond to usage on the plateform after 2015. The current usage metrics is available 48-96 hours after online publication and is updated daily on week days.
Initial download of the metrics may take a while.