Fig. C.1
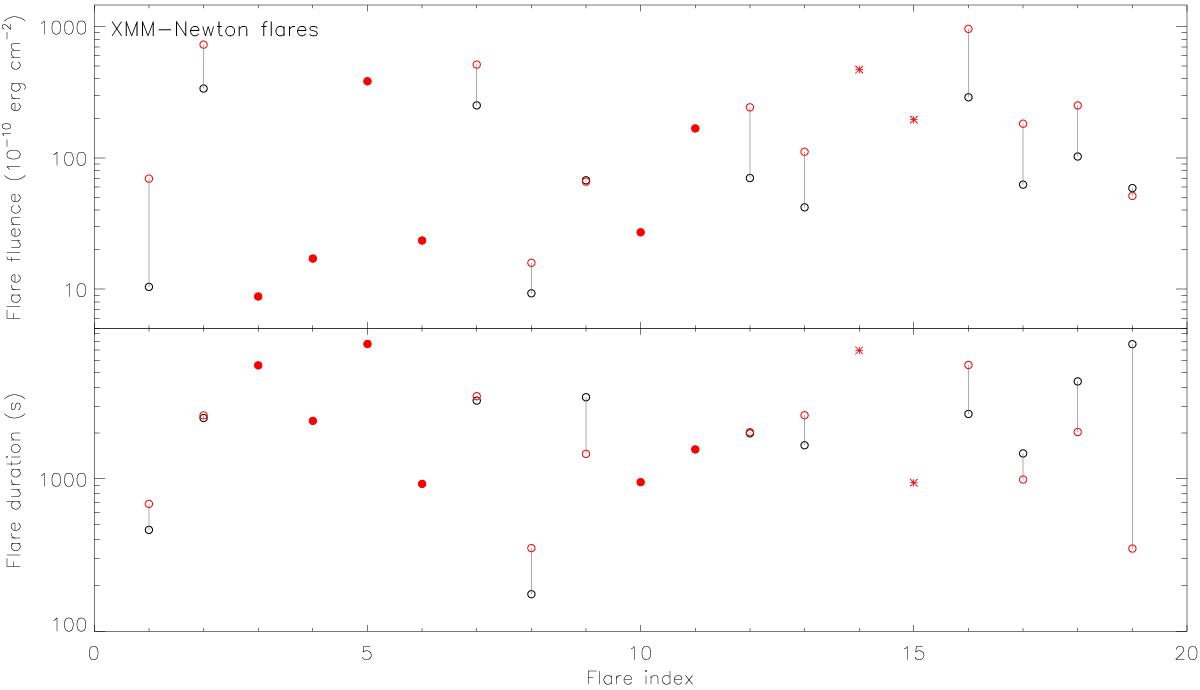
X-ray flare fluences (top panel) and durations (bottom panel) observed with XMM-Newton from 1999 to 2014. The red circles indicate the values computed in this work. The black circles indicate the values computed by Ponti et al. (2015). The red filled circles indicate the flares detected in our work that Ponti et al. (2015) missed. The gray lines connect the same flares. The x-axis reports the flare index corresponding to its numbering in Table A.1 and Fig. B.1. The asterisks denote the flares detected in the observations recently released.
Current usage metrics show cumulative count of Article Views (full-text article views including HTML views, PDF and ePub downloads, according to the available data) and Abstracts Views on Vision4Press platform.
Data correspond to usage on the plateform after 2015. The current usage metrics is available 48-96 hours after online publication and is updated daily on week days.
Initial download of the metrics may take a while.