Free Access
Fig. 4
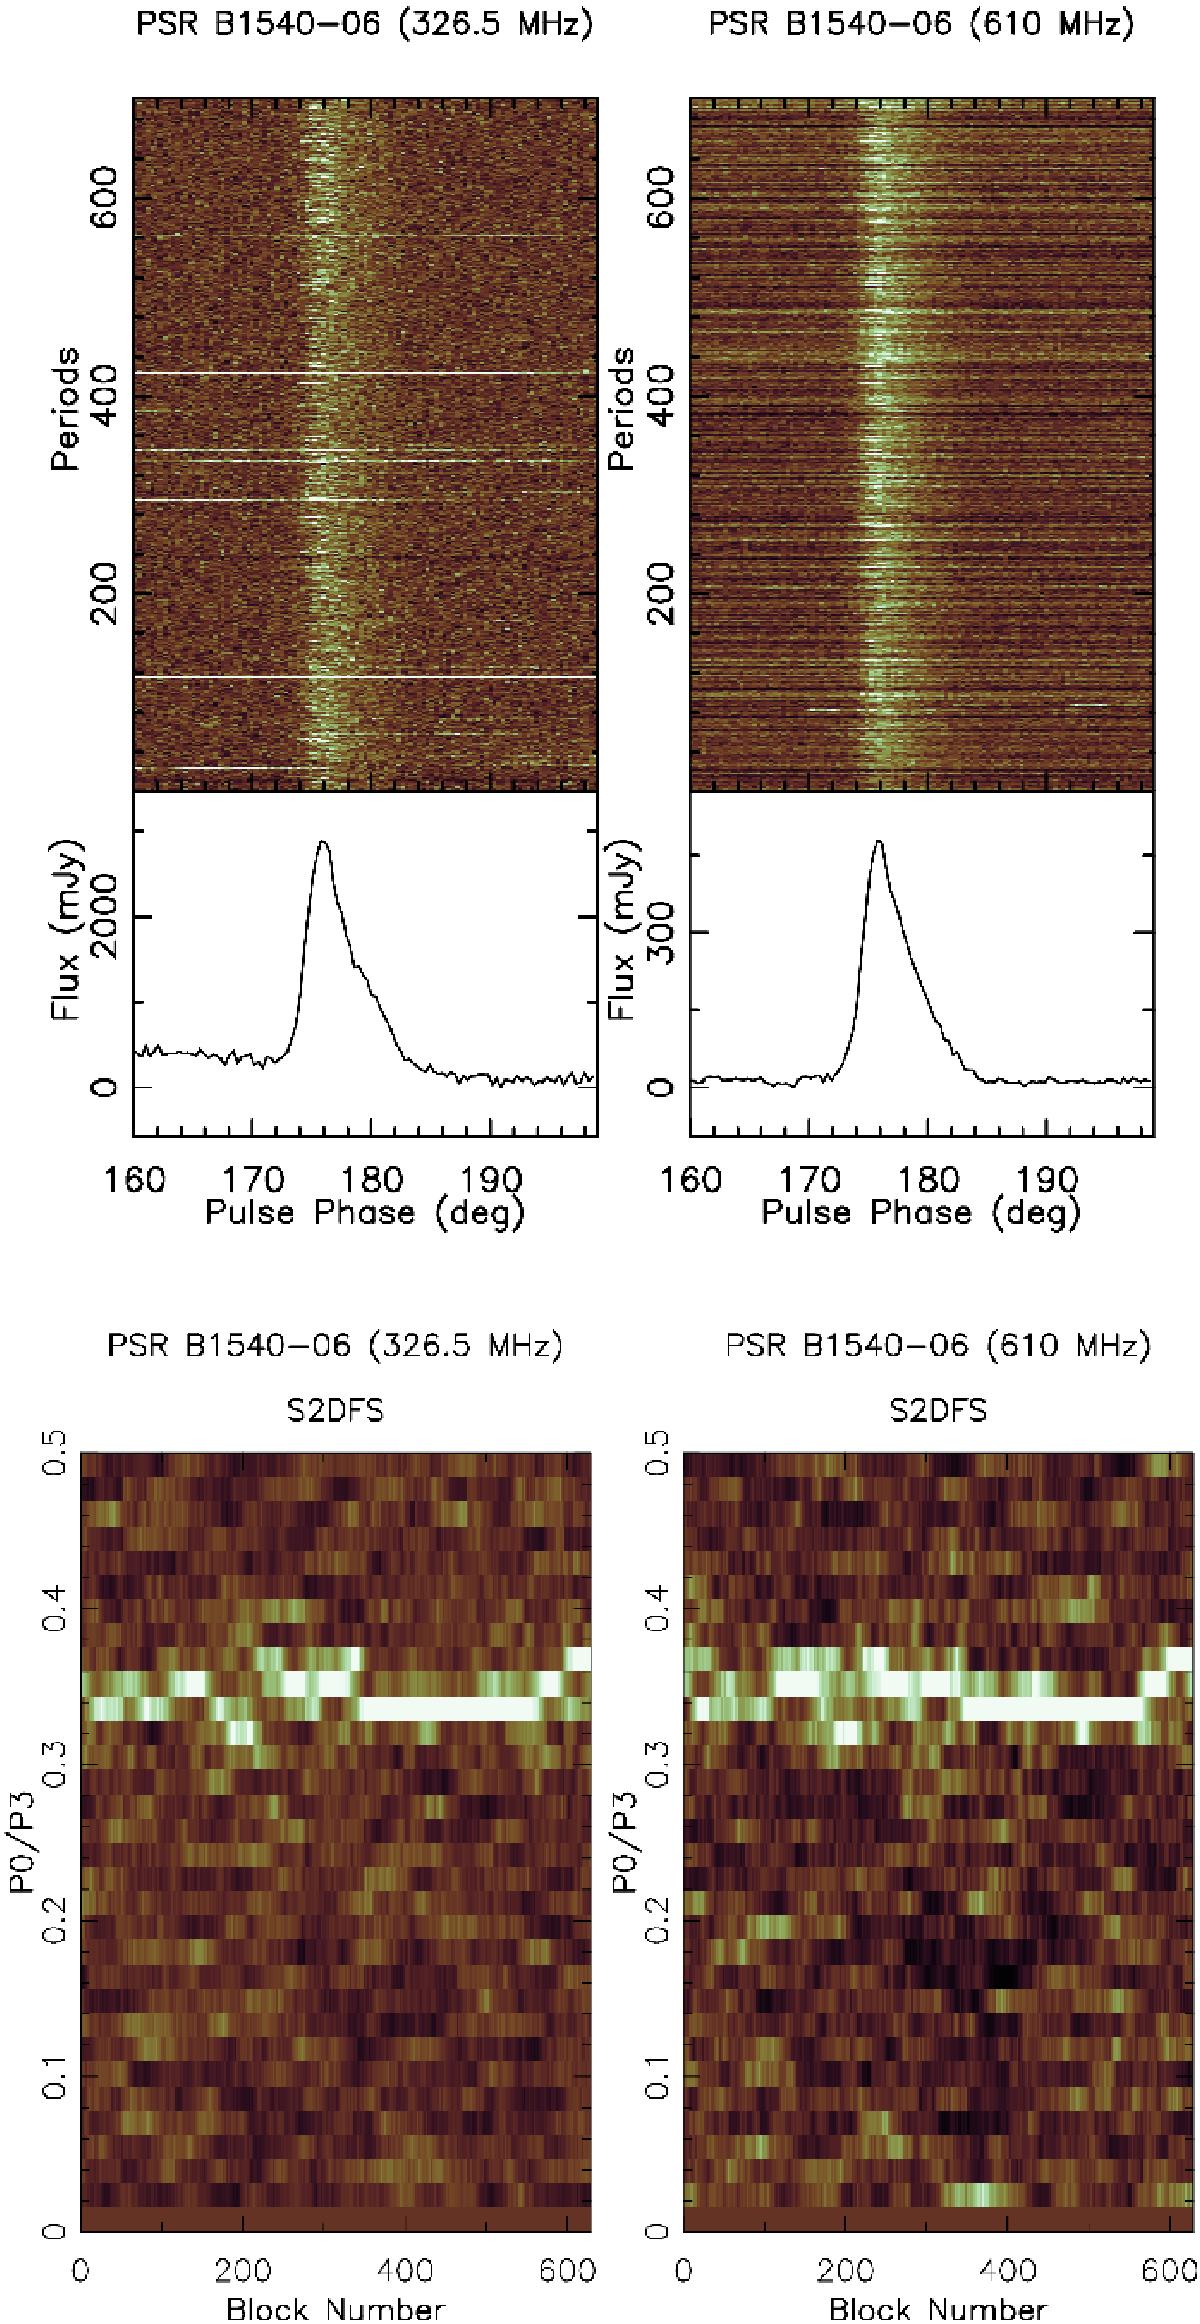
Example sequences of about 600 successive pulses of PSR B1540−06 observed at two different frequencies is presented in the top plot. The corresponding S2DFS plots using a window size of 64 pulses are shown in the lower plots.
Current usage metrics show cumulative count of Article Views (full-text article views including HTML views, PDF and ePub downloads, according to the available data) and Abstracts Views on Vision4Press platform.
Data correspond to usage on the plateform after 2015. The current usage metrics is available 48-96 hours after online publication and is updated daily on week days.
Initial download of the metrics may take a while.