Fig. 4
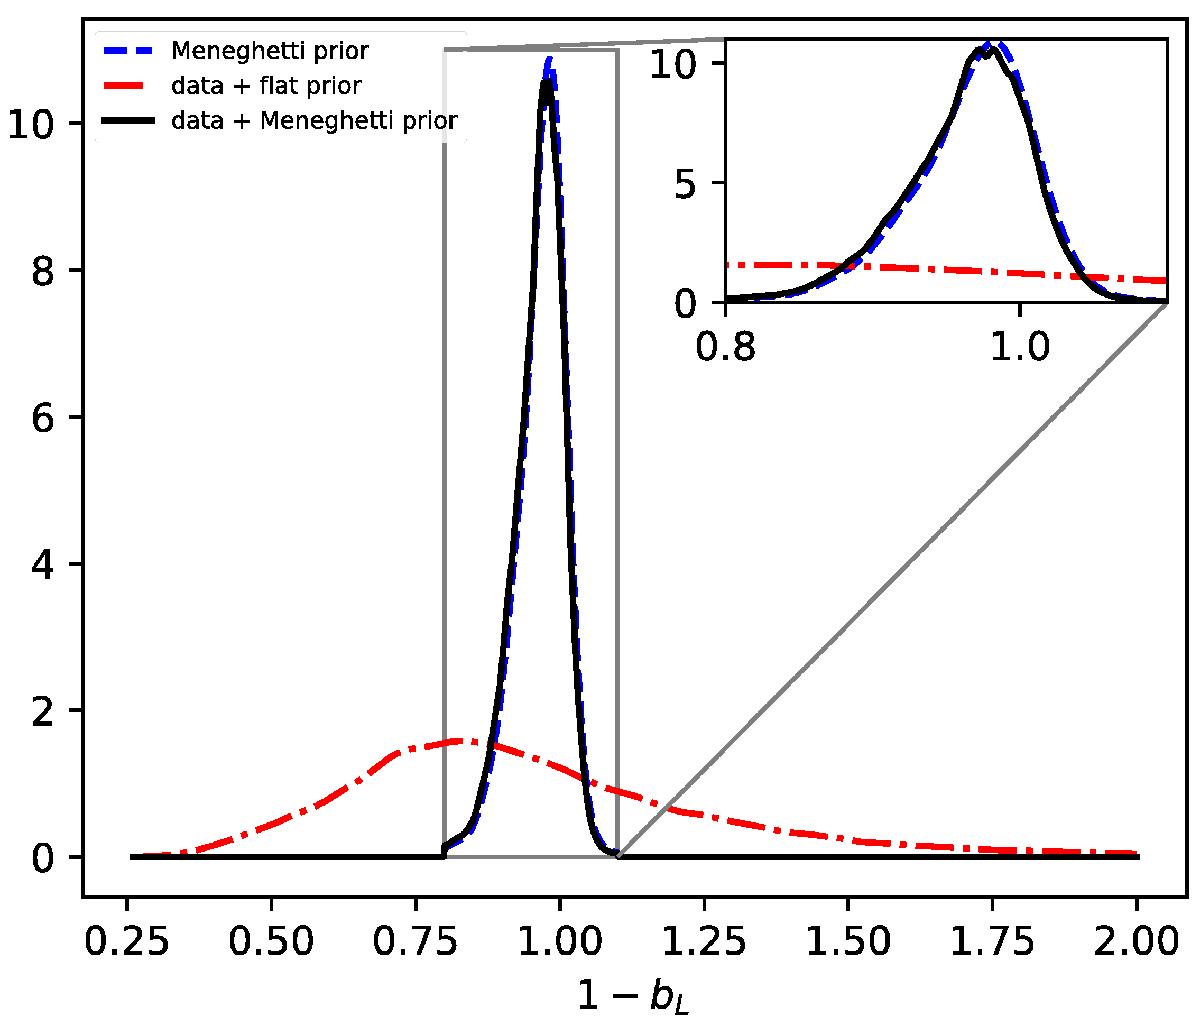
Prior distributions for the lensing mass bias parameter, bL. The blue dashed line represents the Meneghetti prior, i.e., the 3D lensing-true mass ratio distribution (Meneghetti et al. 2014). The other curves give the 1−bL posterior distributions in the case of flat (red line) and Meneguetti (black line) priors obtained from the MCMC analyses of the CLASH-Planck cluster sample (data).
Current usage metrics show cumulative count of Article Views (full-text article views including HTML views, PDF and ePub downloads, according to the available data) and Abstracts Views on Vision4Press platform.
Data correspond to usage on the plateform after 2015. The current usage metrics is available 48-96 hours after online publication and is updated daily on week days.
Initial download of the metrics may take a while.