Fig. 1
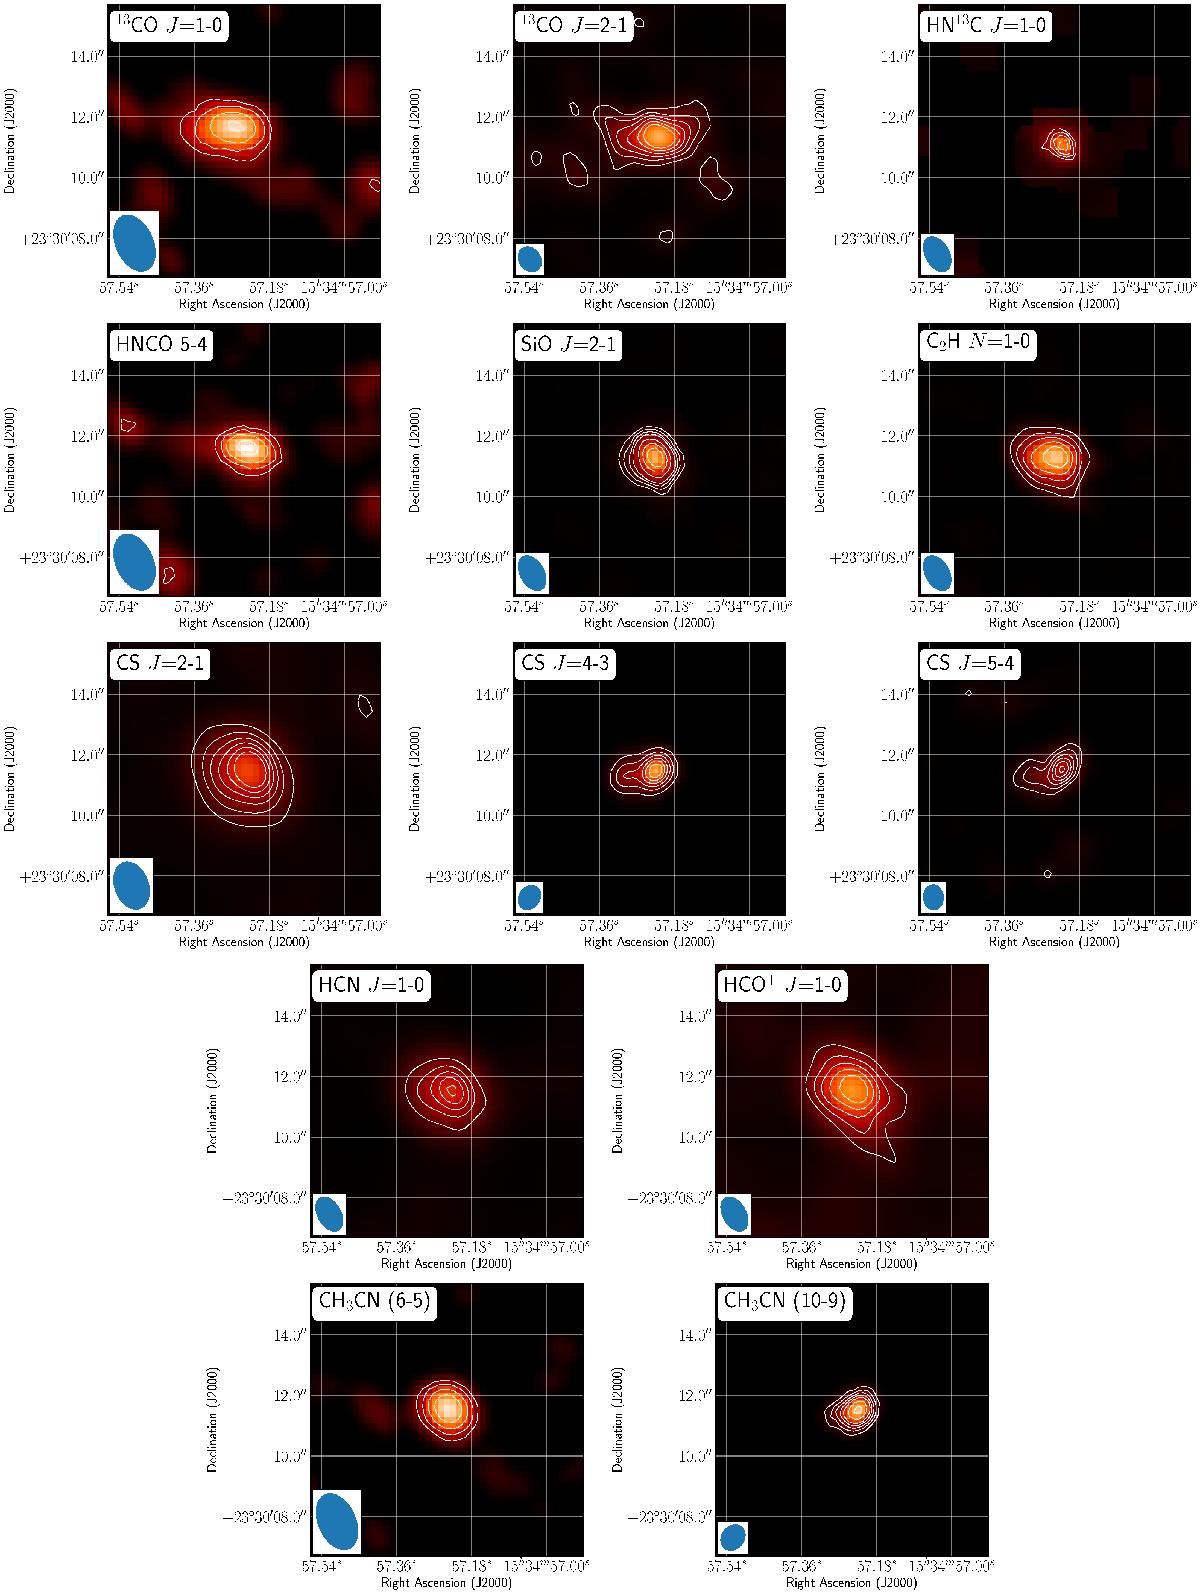
Arp 220: the ellipse in the bottom left corner of each map represents the synthesized beam size. Top row: 12CO J = 1 − 0, J = 2 − 1 and HN13C J = 1 − 0 with contours corresponding to [4, 6, 8, 10] × 0.45 Jy beam-1 km s-1, [4, 8, 12, 16, 20, 24] × 0.5 Jy beam-1 km s-1 and [3, 4, 5, 6] × 0.135 Jy beam-1 km s-1, respectively. (2nd row) HNCO Jk,k′ = 50,4 − 40,4, SiO J = 2 − 1 and C2H N = 1 − 0 with contours corresponding to [4, 6, 8,10] × 0.36 Jy beam-1 km s-1, [4, 6, 8, 10, 15, 20, 25, 30] × 0.135 Jy beam-1 km s-1 and [5, 10, 15, 20, 25] × 0.135 Jy beam-1 km s-1, respectively. (3rd row) CS J = 2 − 1, J = 4 − 3 (ALMA) and J = 5 − 4 with contours corresponding to [4, 8, 12, 16, 20, 24] × 0.5, 1.2 and 0.29 Jy beam-1 km s-1, respectively. (4th row) HCN J = 1 − 0 and HCO+J = 1 − 0 with contours corresponding to [5, 10, 15, 20, 25] × 0.52 and 0.15 Jy beam-1 km s-1, respectively. Bottom row: CH3CN(6−5) and (10−9) with contours corresponding to [4, 6, 8, 10] and [6, 12, 18, 24, 30, 40, 50] × 0.33 Jy beam-1 km s-1, respectively.
Current usage metrics show cumulative count of Article Views (full-text article views including HTML views, PDF and ePub downloads, according to the available data) and Abstracts Views on Vision4Press platform.
Data correspond to usage on the plateform after 2015. The current usage metrics is available 48-96 hours after online publication and is updated daily on week days.
Initial download of the metrics may take a while.