Free Access
Fig. 6
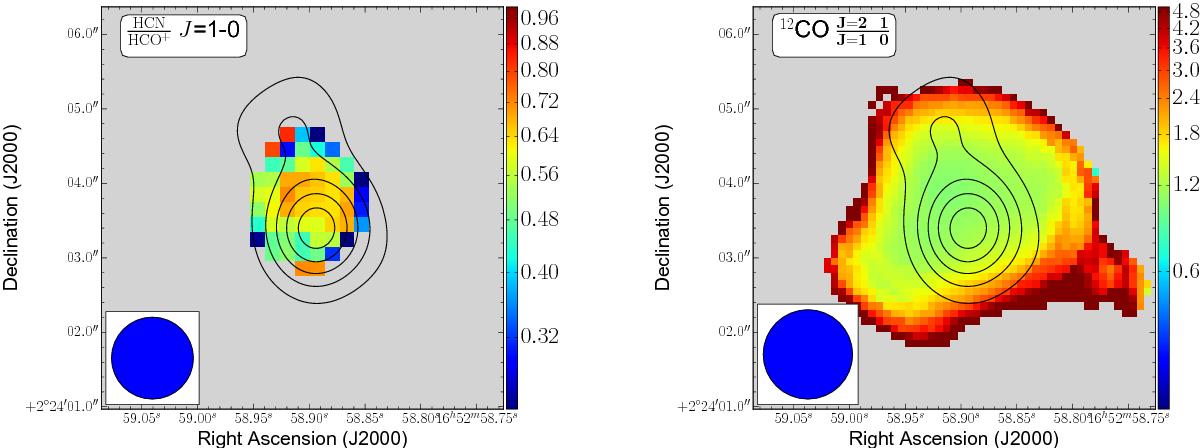
NGC 6240 Line ratios: left H10 and right r21. The ellipse in the bottom left corner of each map represents the synthesized beam size. The black contours represent the 86 GHz continuum emission to guide the eye to the positions of the two nuclei of NGC 6240.
Current usage metrics show cumulative count of Article Views (full-text article views including HTML views, PDF and ePub downloads, according to the available data) and Abstracts Views on Vision4Press platform.
Data correspond to usage on the plateform after 2015. The current usage metrics is available 48-96 hours after online publication and is updated daily on week days.
Initial download of the metrics may take a while.