Fig. 5
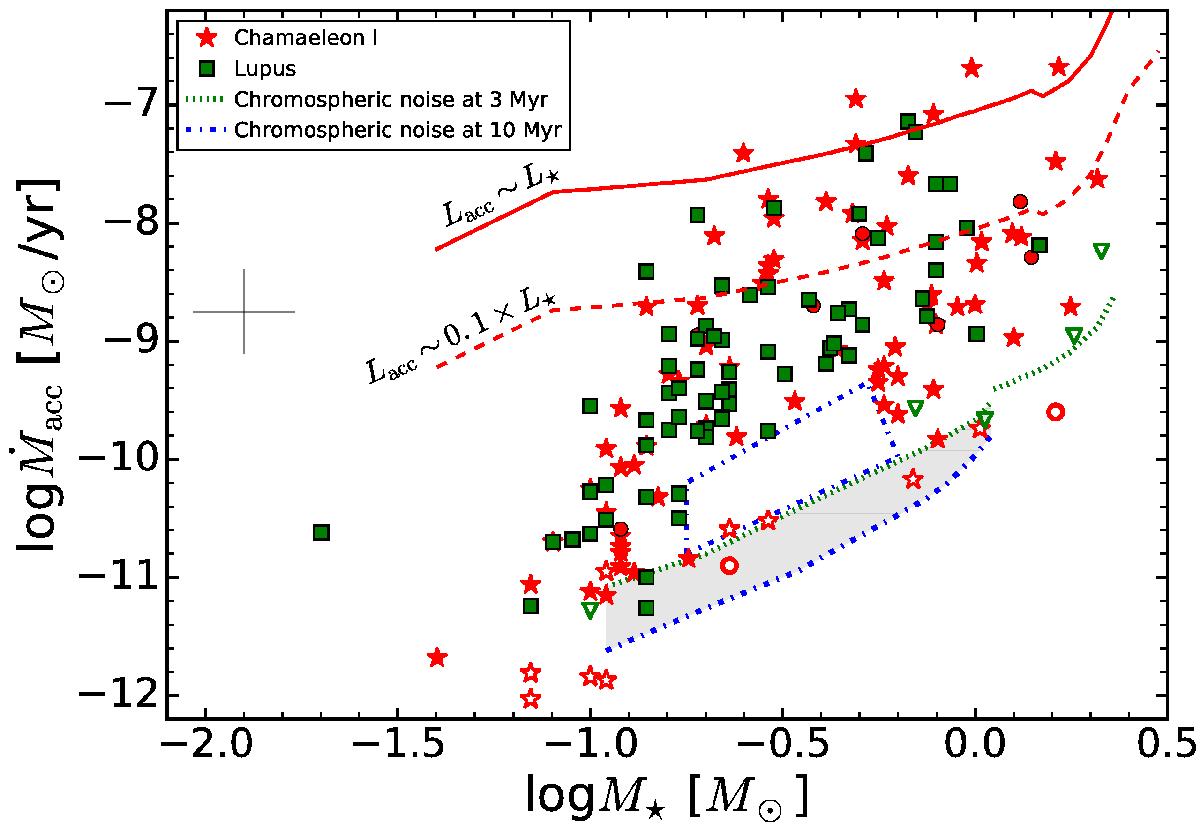
Accretion rate vs. stellar mass for the objects with disks in the Chamaeleon I star-forming region and those in the Lupus star-forming regions studied by Alcalá et al. (2014, 2017). Symbols are the same as in Fig. 3. The upper boundary expected by theory of Lacc = L⋆ and the lower limit imposed by chromospheric emission are shown. The blue dot-dashed box highlights the extent of the region that is empty of data, possibly as a result of photoevaporation of the disks.
Current usage metrics show cumulative count of Article Views (full-text article views including HTML views, PDF and ePub downloads, according to the available data) and Abstracts Views on Vision4Press platform.
Data correspond to usage on the plateform after 2015. The current usage metrics is available 48-96 hours after online publication and is updated daily on week days.
Initial download of the metrics may take a while.