Fig. 3
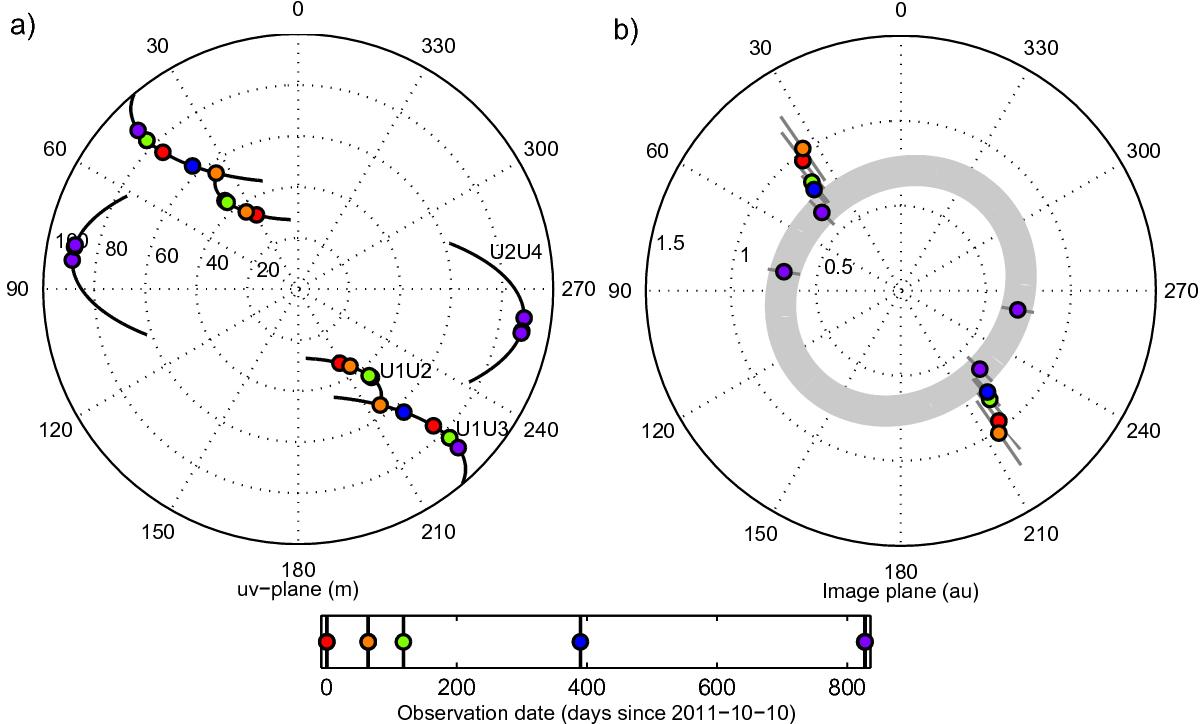
a)uv-plot of DG Tau MIDI observations. The tracks correspond to specific telescope configurations. b) Disk half-light radii, determined from visibilities for each epoch. The symbols are color-coded for observation date. Position angles are measured from North to East (counterclockwise). The radial scale of the plot is given in au.
Current usage metrics show cumulative count of Article Views (full-text article views including HTML views, PDF and ePub downloads, according to the available data) and Abstracts Views on Vision4Press platform.
Data correspond to usage on the plateform after 2015. The current usage metrics is available 48-96 hours after online publication and is updated daily on week days.
Initial download of the metrics may take a while.