Free Access
Fig. 15
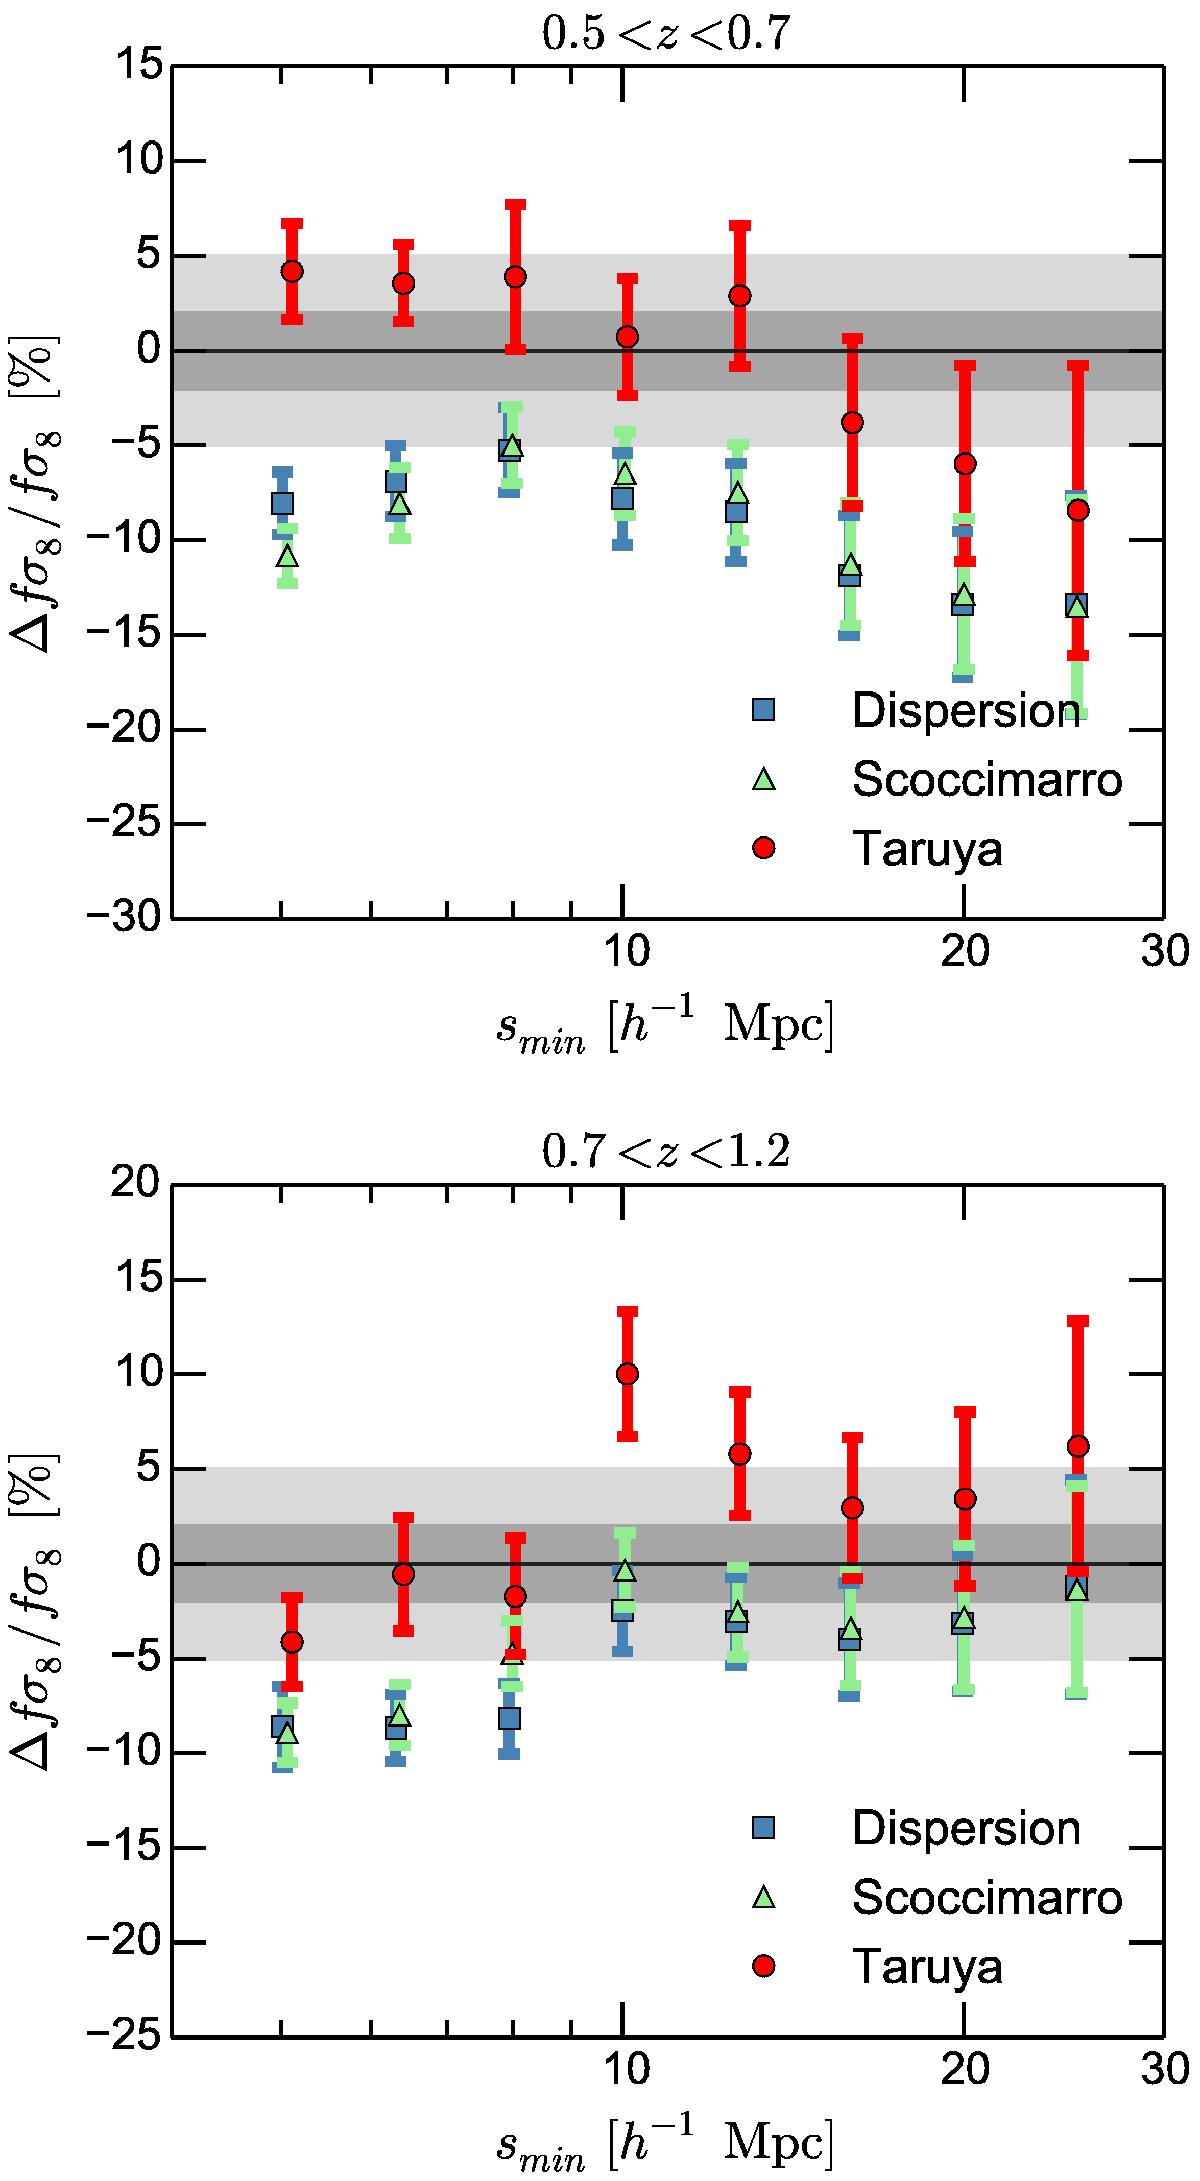
Same as Fig. 14, but now using the fully realistic observed mocks, on which all observational effects (masks, SPOC selection, and redshift errors) were included. As before, error bars correspond to the error on the average of the 153 samples.
This figure is made of several images, please see below:
Current usage metrics show cumulative count of Article Views (full-text article views including HTML views, PDF and ePub downloads, according to the available data) and Abstracts Views on Vision4Press platform.
Data correspond to usage on the plateform after 2015. The current usage metrics is available 48-96 hours after online publication and is updated daily on week days.
Initial download of the metrics may take a while.