Fig. 16
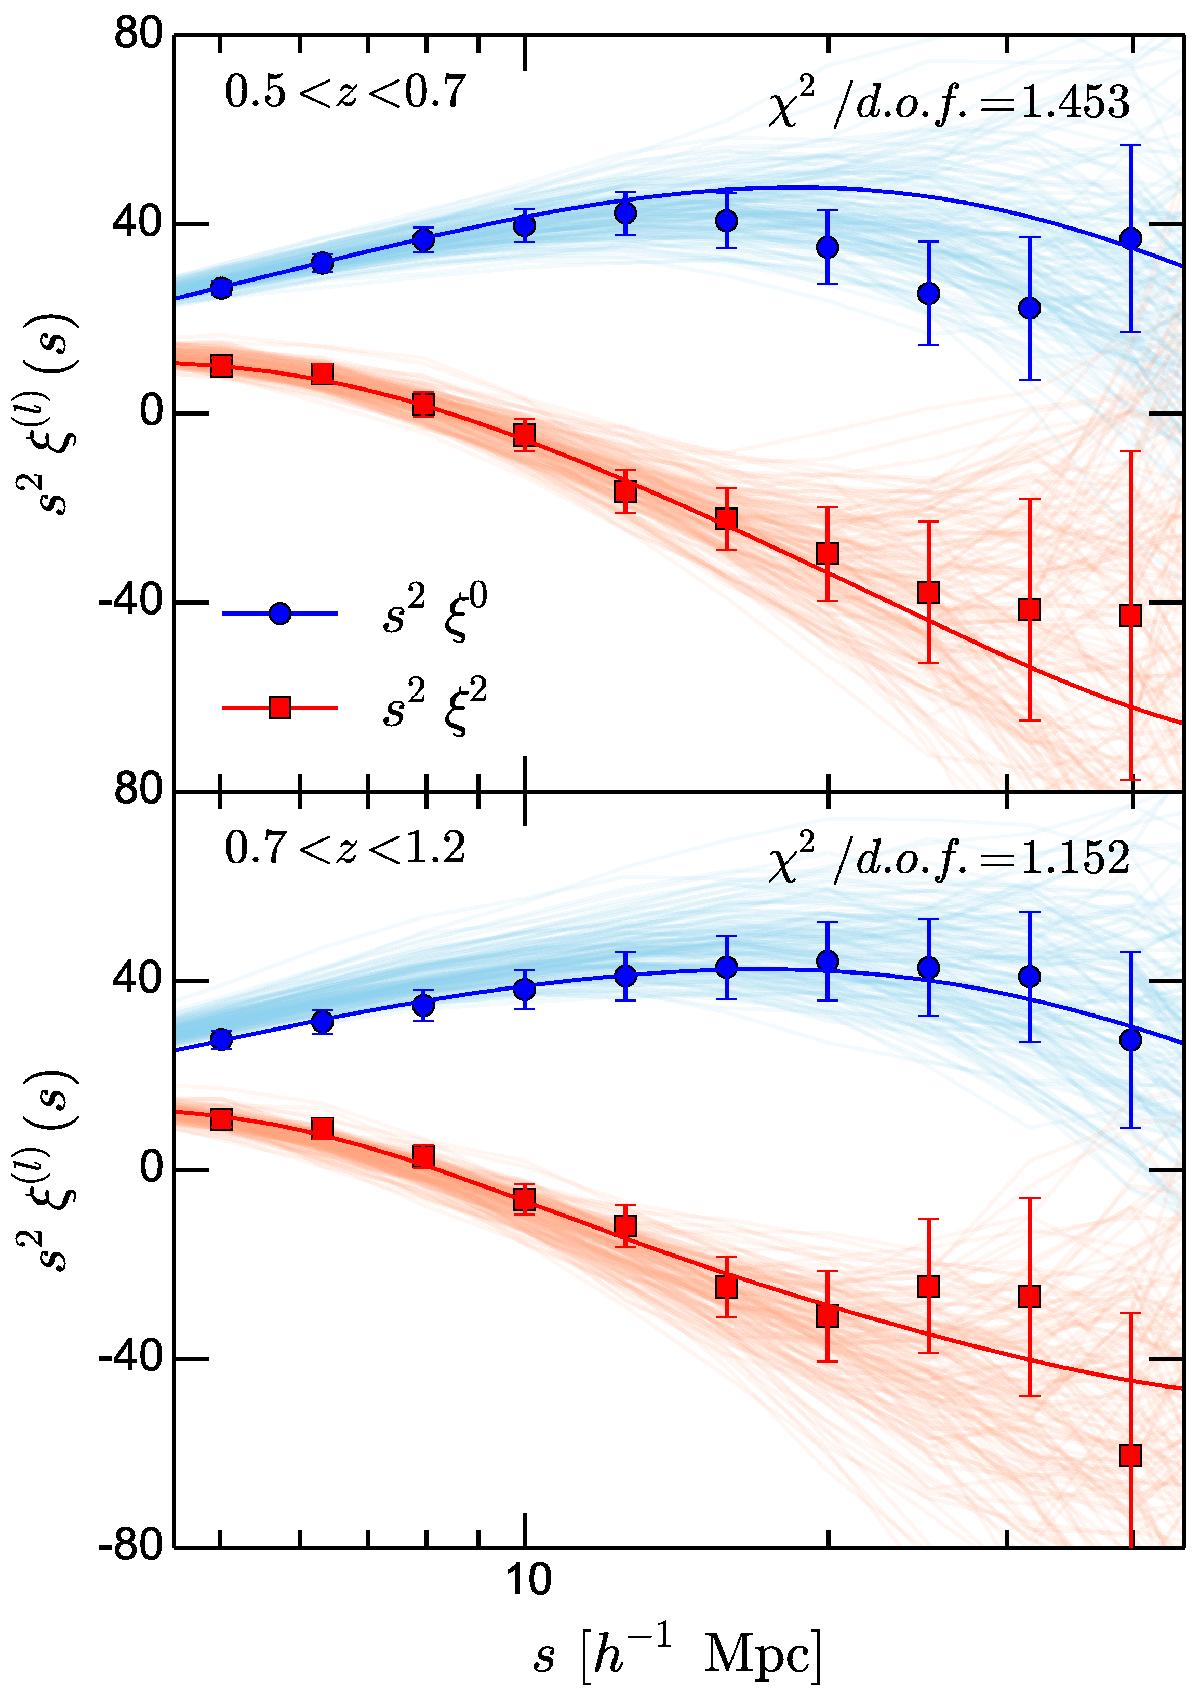
Monopole and quadrupole of ξ(rp,π) for the two redshift subsamples of the final VIPERS dataset (solid points), together with the final best-fitting curves obtained using the TNS model, corresponding to the values reported in Table 2. The likelihood computation has used data down to smin = 5 h-1 Mpc, as indicated by the tests. Error bars are 1σ deviations and correspond to the dispersion of the mock measurements. Each of these is also shown as a faint background line.
Current usage metrics show cumulative count of Article Views (full-text article views including HTML views, PDF and ePub downloads, according to the available data) and Abstracts Views on Vision4Press platform.
Data correspond to usage on the plateform after 2015. The current usage metrics is available 48-96 hours after online publication and is updated daily on week days.
Initial download of the metrics may take a while.