Fig. 7
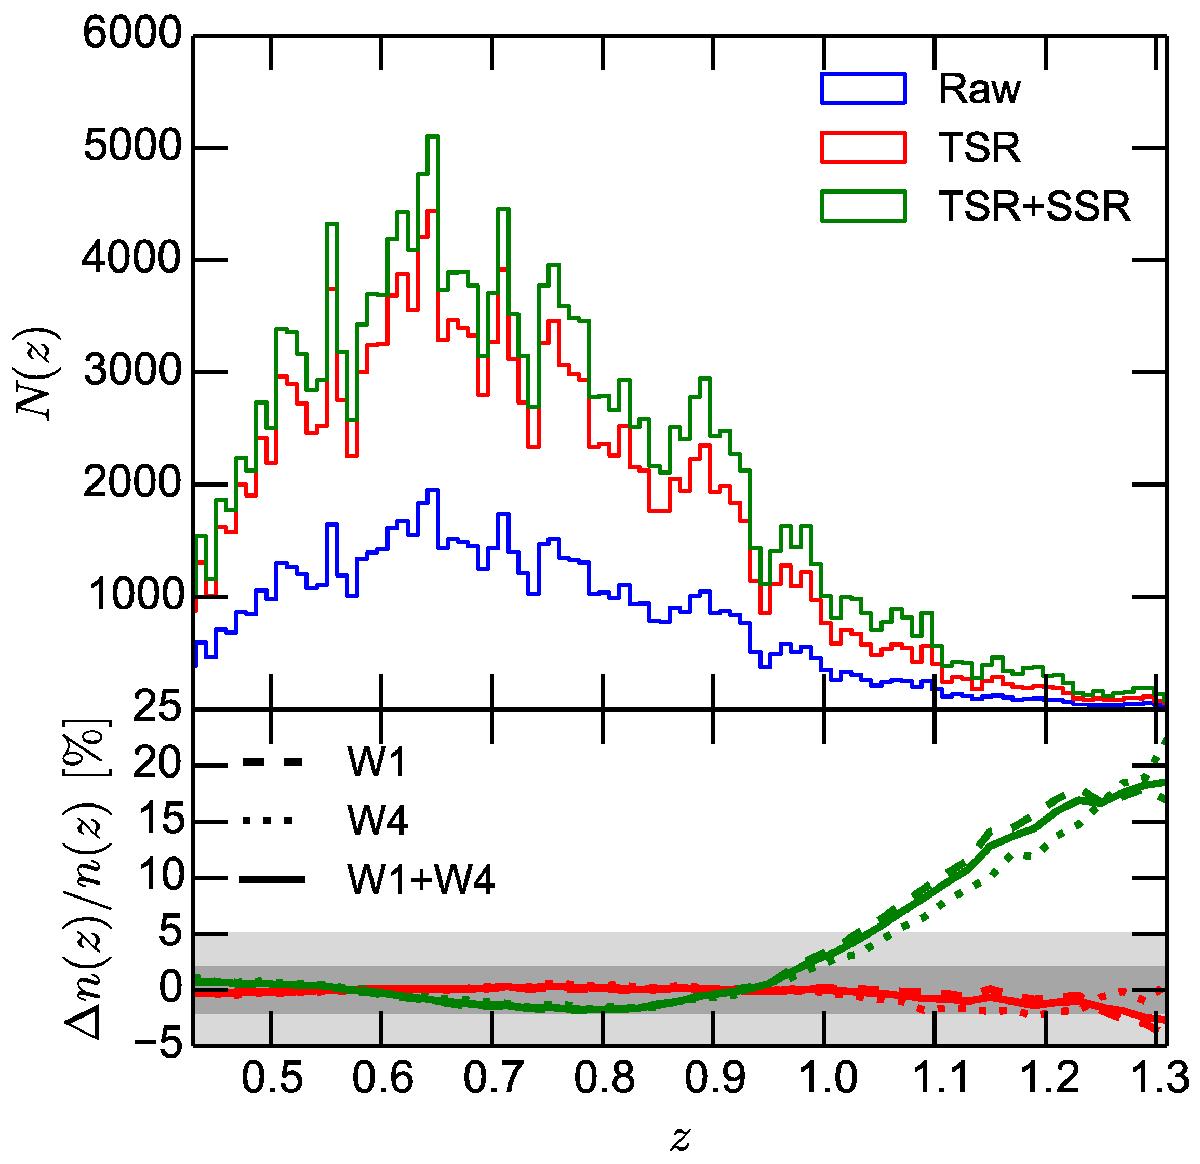
Impact of the TSR and the SSR on the radial profile of the VIPERS galaxy samples. In the bottom panel we plot the relative difference of the Vmax fits to the redshift distribution after applying the correction to the same obtained from the observed histogram. Dashed, dotted, and solid lines give the results for W1, W4, and the combined measurement, respectively. The smoothed radial profile is estimated using the Vmax method. While the TSR does not affect the redshift distribution, the SSR enhances the number counts at z> 0.95.
Current usage metrics show cumulative count of Article Views (full-text article views including HTML views, PDF and ePub downloads, according to the available data) and Abstracts Views on Vision4Press platform.
Data correspond to usage on the plateform after 2015. The current usage metrics is available 48-96 hours after online publication and is updated daily on week days.
Initial download of the metrics may take a while.