Free Access
Fig. 4
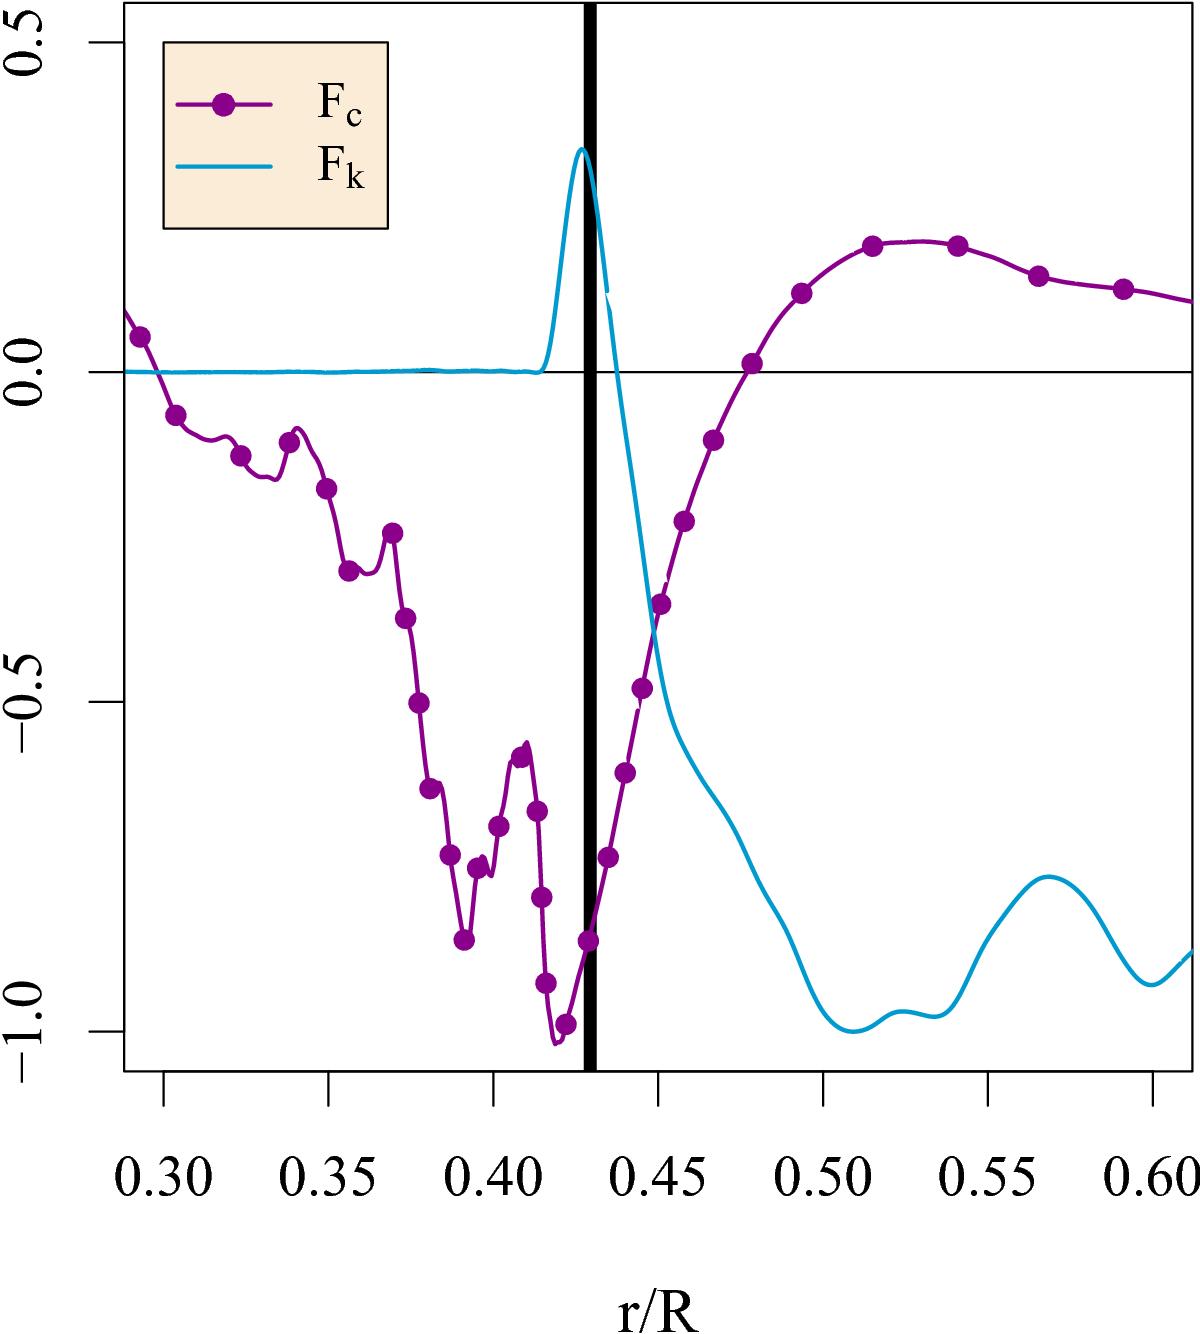
Radial profile of the time-averaged and horizontally volume-averaged vertical kinetic energy flux Fk defined in Eq. (6), and vertical heat flux Fc defined in Eq. (7)for simulation YS4. Both of these fluxes have been normalized to their absolute maximum value. The heavy vertical black line marks the convective boundary.
Current usage metrics show cumulative count of Article Views (full-text article views including HTML views, PDF and ePub downloads, according to the available data) and Abstracts Views on Vision4Press platform.
Data correspond to usage on the plateform after 2015. The current usage metrics is available 48-96 hours after online publication and is updated daily on week days.
Initial download of the metrics may take a while.