Fig. 7
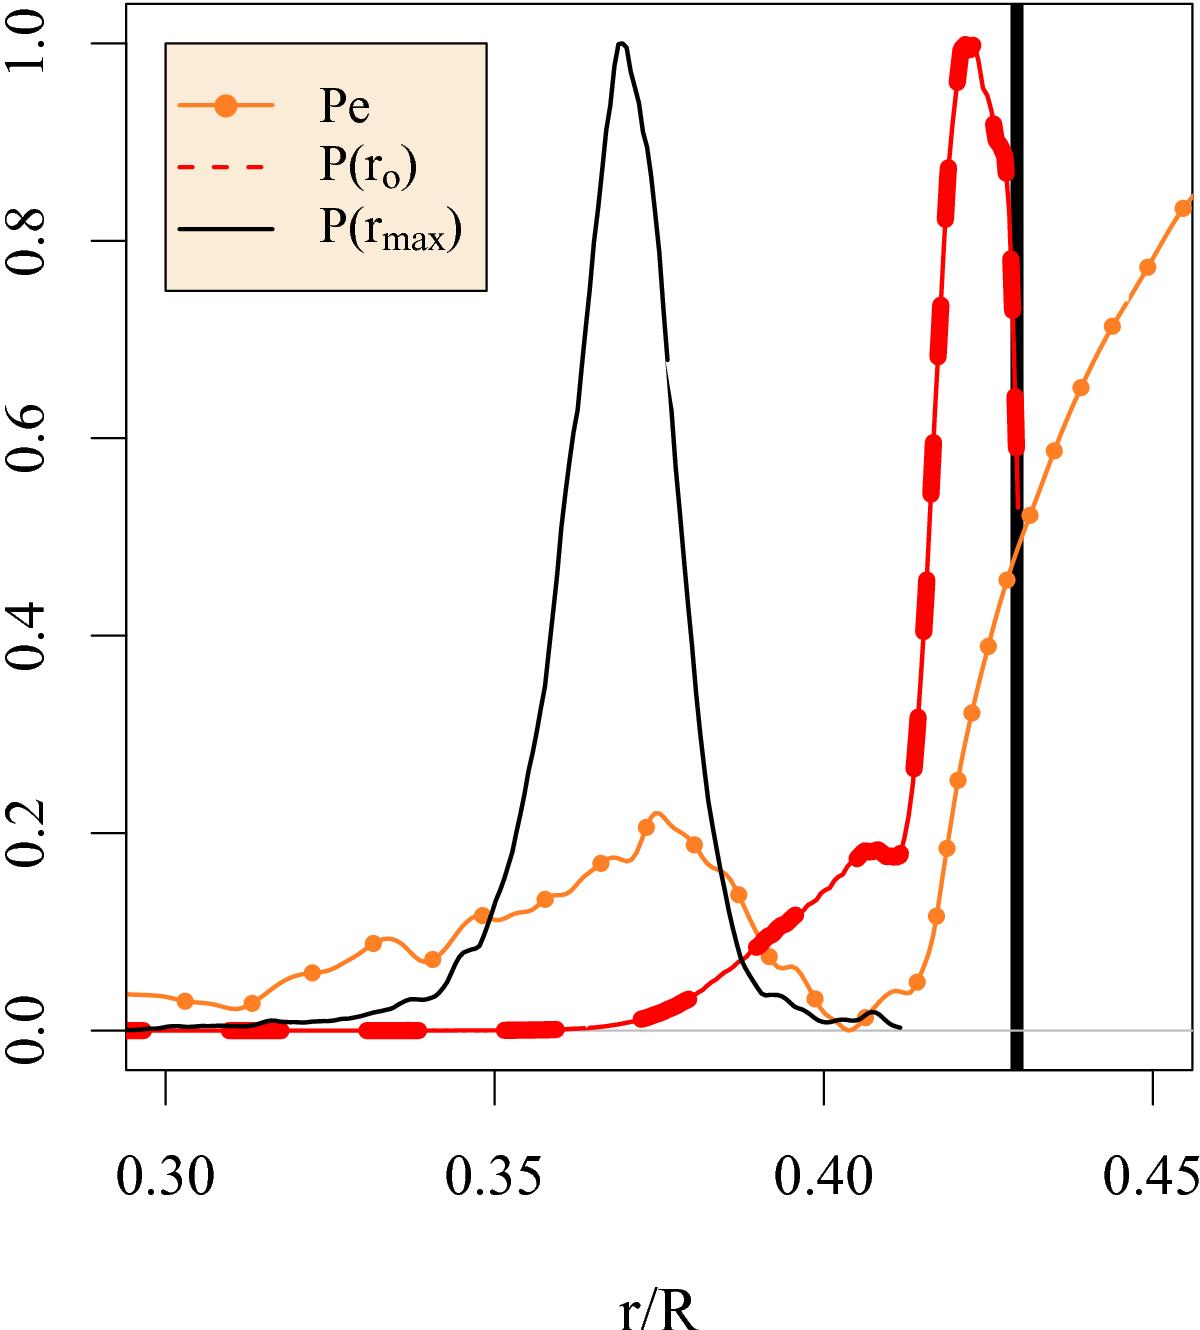
PDF of the convective penetration depth for all plumes ro (dashed line), PDF of the maximal penetration depth at any time rmax (solid line), and the time- and horizontally volume-averaged Péclet number (dotted line) for simulation YS4. Each of these quantities is vertically shifted and scaled for comparison. The convective boundary is delineated by a heavy vertical line.
Current usage metrics show cumulative count of Article Views (full-text article views including HTML views, PDF and ePub downloads, according to the available data) and Abstracts Views on Vision4Press platform.
Data correspond to usage on the plateform after 2015. The current usage metrics is available 48-96 hours after online publication and is updated daily on week days.
Initial download of the metrics may take a while.