Fig. 10
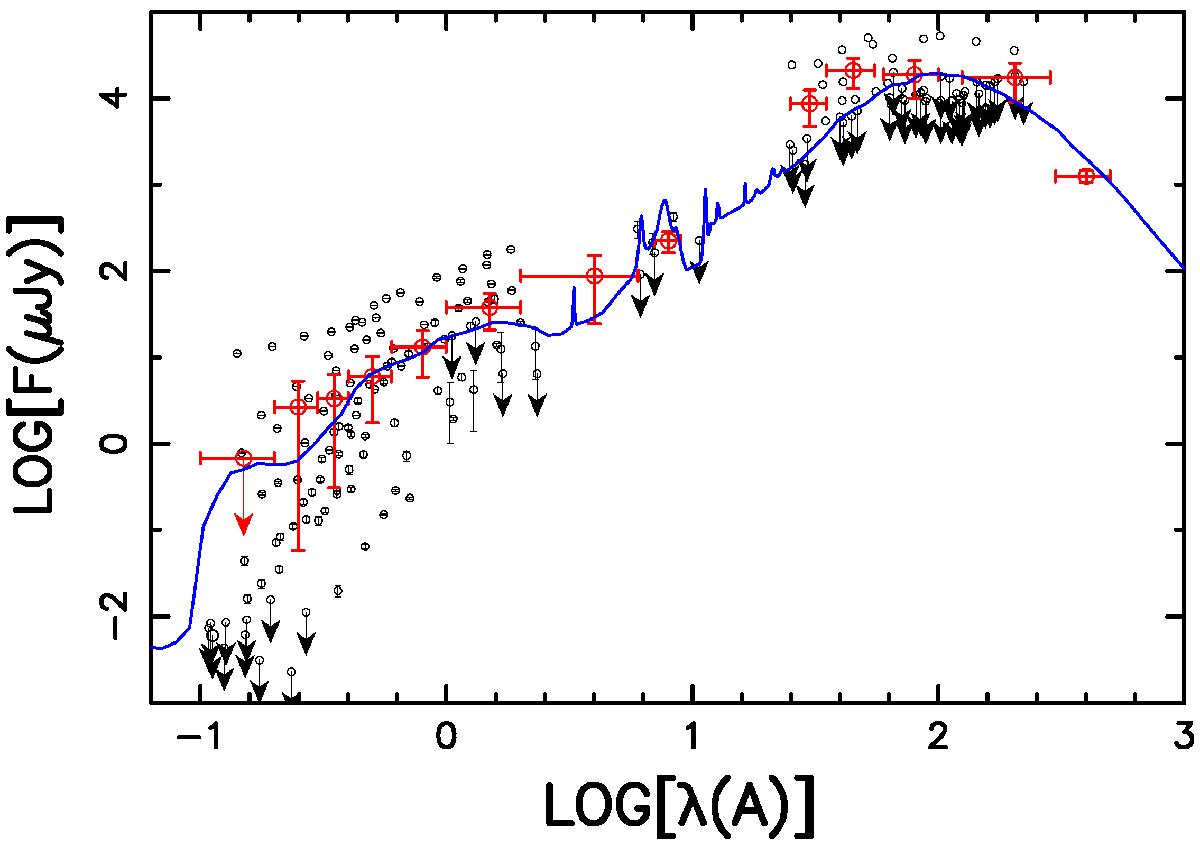
Stacked SED computed from the 12 ALMA 1.1 mm sources analyzed in this study. The black dots and limits show the photometry of all the sources after de-redshifting the SEDs and normalizing them by their 1.1 mm flux density. The red points present the stacked photometry, where error bars on the flux densities are derived from the standard deviation in each bin. The blue curve denotes the SED template from Kirkpatrick et al. (2015), combining star formation and AGN contributions.
Current usage metrics show cumulative count of Article Views (full-text article views including HTML views, PDF and ePub downloads, according to the available data) and Abstracts Views on Vision4Press platform.
Data correspond to usage on the plateform after 2015. The current usage metrics is available 48-96 hours after online publication and is updated daily on week days.
Initial download of the metrics may take a while.