Fig. 2
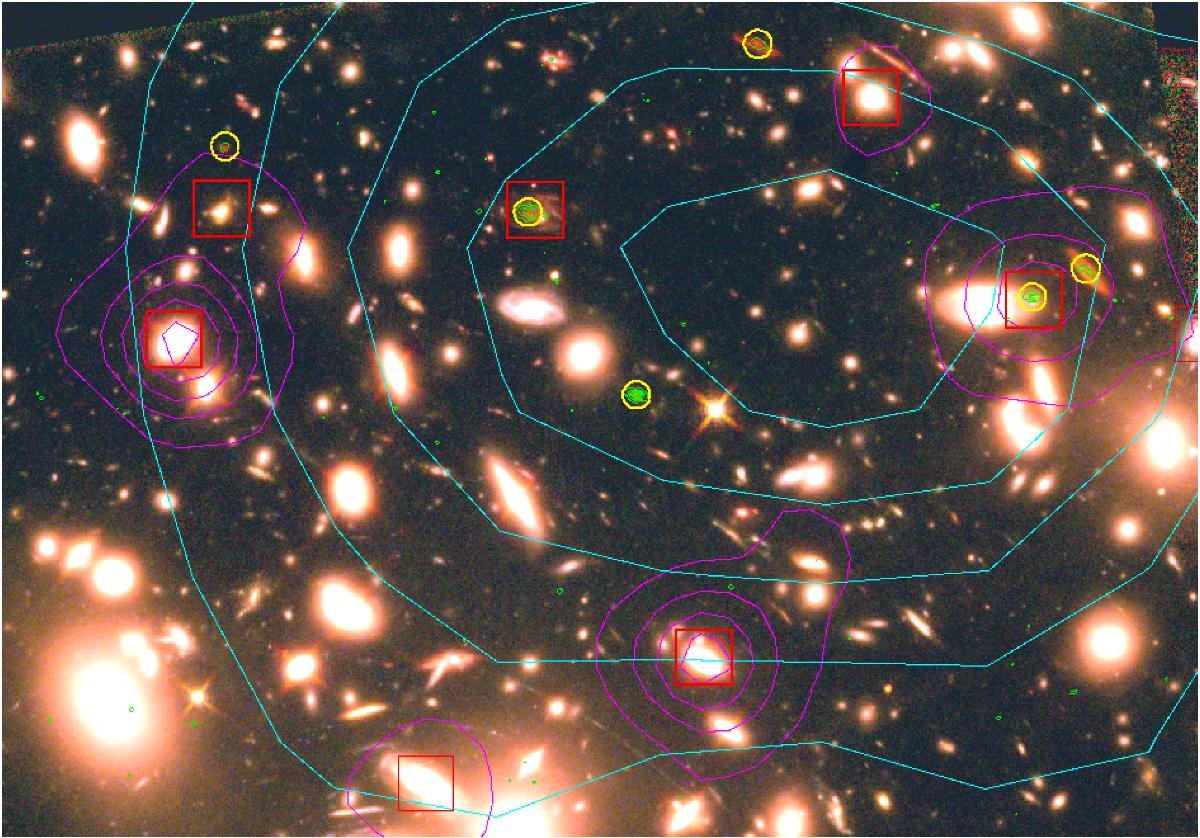
HST color image (F814W as blue, F125W as green, and F160W as red) showing the NW corner of the galaxy cluster A2744. The red squares denote the FIR counterparts found by Rawle et al. (2016), while the yellow circles correspond to the ALMA detected sources. The green, cyan, and magenta contours show emission in the ALMA 1.1 mm, SPIRE 500 μm, and PACS 100 μm images, respectively. The low overlap (~40%) between the PACS and ALMA samples highlights the potential difficulty and disconnect of making identifications based on mid-IR priors combined with low resolution and blended Herschel imaging alone. The resulting deblended photometry can be very different when longer wavelength counterparts are incorporated into the process. In particular, a large fraction of the SPIRE 500 μm emission shown here arises from the ALMA-detected counterparts and not from the PACS-detected ones. As in Fig. 1, the ALMA 1.1 mm green contours start at 4σ (220 μJy/beam) and increase in 2σ increments (110 μJy/beam). The SPIRE 500 μm cyan contours start at 0.005 Jy/beam and increment by 0.0034 Jy/beam. And the PACS 100 μm magenta contours start 0.08 Jy/beam and increment by 0.12 Jy/beam.
Current usage metrics show cumulative count of Article Views (full-text article views including HTML views, PDF and ePub downloads, according to the available data) and Abstracts Views on Vision4Press platform.
Data correspond to usage on the plateform after 2015. The current usage metrics is available 48-96 hours after online publication and is updated daily on week days.
Initial download of the metrics may take a while.