Fig. 3
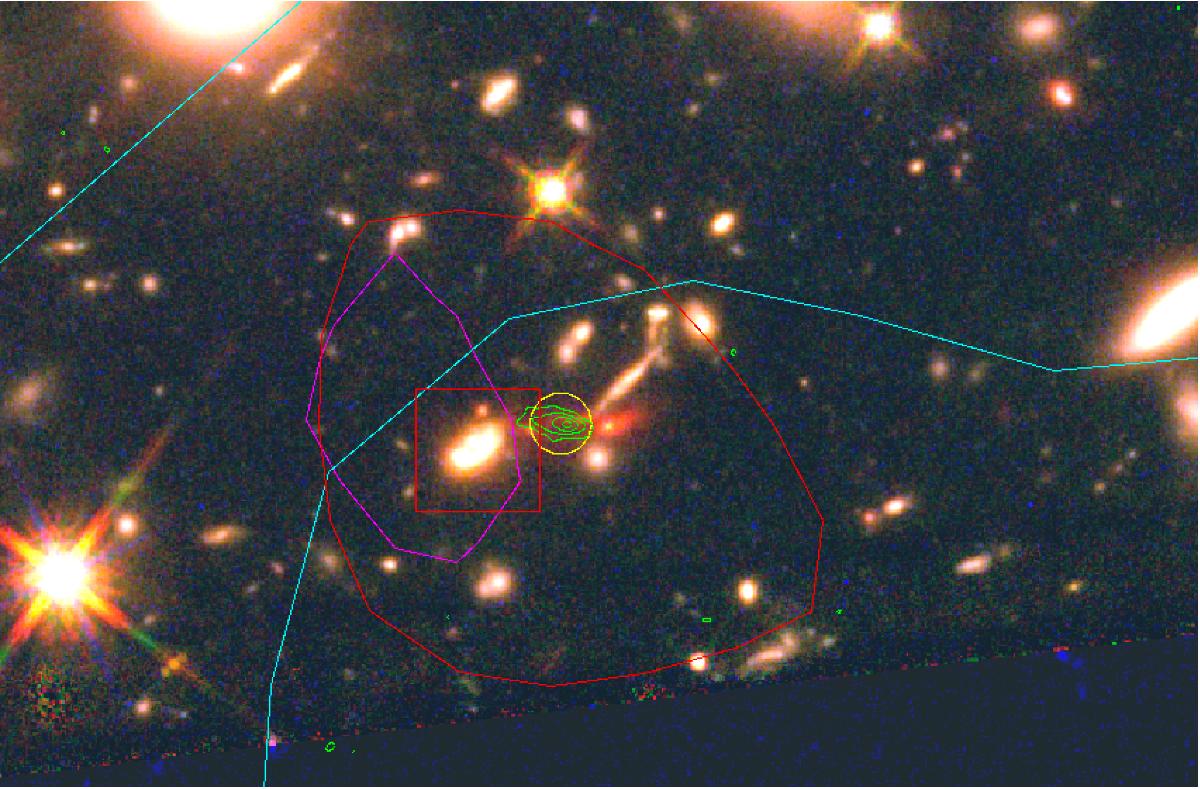
HST color image showing the vicinity of A2744-ID02, highlighting the potential for misidentification of FIR counterparts even for relatively isolated objects. Symbols and contours same as Fig. 2, with the addition of red contours denoting emission at 160 μm. PACS 160 μm contours start at 0.08 Jy/beam and increments by 0.16 Jy/beam. While the 100 μm contours are offset from A2744-ID02, the 160 μm (and all longer wavelength) emission is centered on the ALMA source, indicating that most of the FIR emission assigned to the galaxy denoted by the red square in fact is likely to be associated with the ALMA-detected galaxy.
Current usage metrics show cumulative count of Article Views (full-text article views including HTML views, PDF and ePub downloads, according to the available data) and Abstracts Views on Vision4Press platform.
Data correspond to usage on the plateform after 2015. The current usage metrics is available 48-96 hours after online publication and is updated daily on week days.
Initial download of the metrics may take a while.