Fig. 7
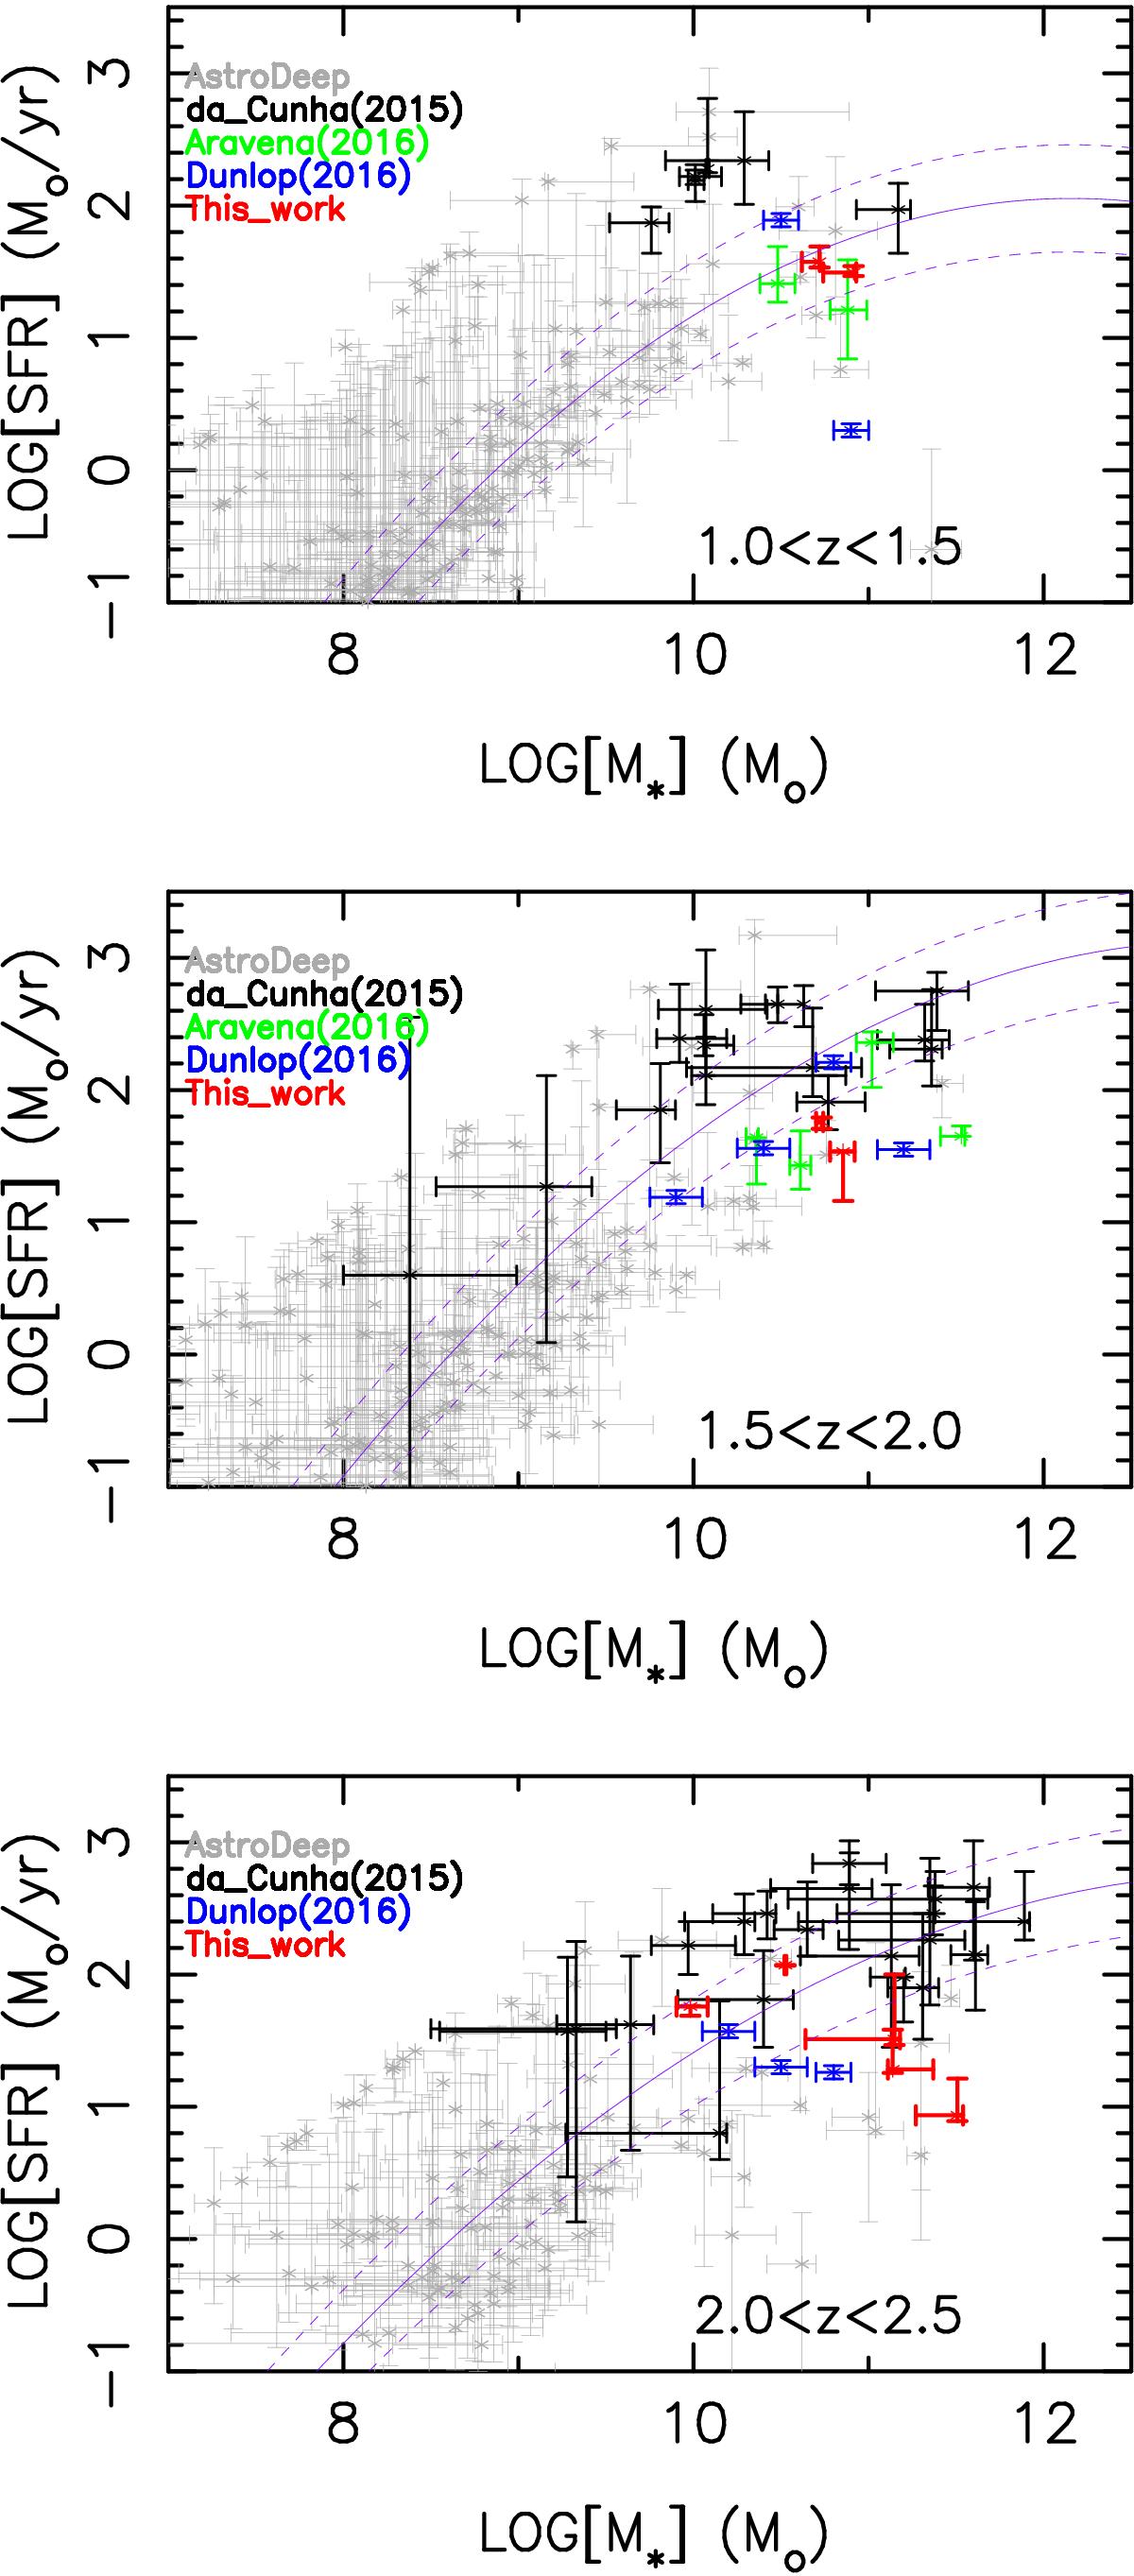
M∗ vs. SFR for the ALMA-FFs DSFG sample (red points) and all field galaxies in the AstroDeep FFs catalogs (grey points), divided into three redshift ranges (top: 1.0 <z< 1.5; middle: 1.5 <z< 2.0; bottom: 2.0 <z< 2.5). We also show comparable objects from several recent ALMA studies (da Cunha et al. 2015 – black points; Aravena et al. 2016 – green points; Dunlop et al. 2017 – blue points). We overplot the Main Sequence established in each redshift interval by Whitaker et al. (2014) as solid purple curves, while the dashed curves represent the typical factor of 3 dispersion as suggested in da Cunha et al. (2015).
Current usage metrics show cumulative count of Article Views (full-text article views including HTML views, PDF and ePub downloads, according to the available data) and Abstracts Views on Vision4Press platform.
Data correspond to usage on the plateform after 2015. The current usage metrics is available 48-96 hours after online publication and is updated daily on week days.
Initial download of the metrics may take a while.