Fig. 2
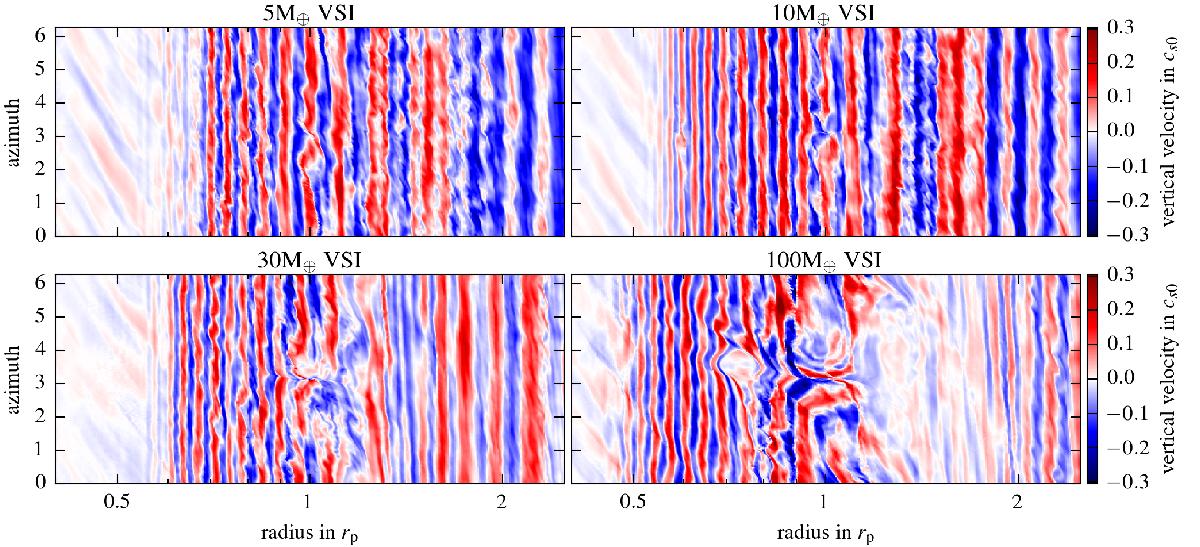
Vertical velocity in the midplane of the VSI disc after 198 orbits with embedded planets of different mass. Upward motion is indicated in red and downwards motion in blue. Larger planets clearly disrupt the usual VSI modes close to the planet. In the last panel (100 M⊕ planet) vortices are visible at both sides of the planet. Also visible in the last panel is the more extended VSI activity near the inner boundary compared to the other panels.
Current usage metrics show cumulative count of Article Views (full-text article views including HTML views, PDF and ePub downloads, according to the available data) and Abstracts Views on Vision4Press platform.
Data correspond to usage on the plateform after 2015. The current usage metrics is available 48-96 hours after online publication and is updated daily on week days.
Initial download of the metrics may take a while.