Free Access
Fig. 5
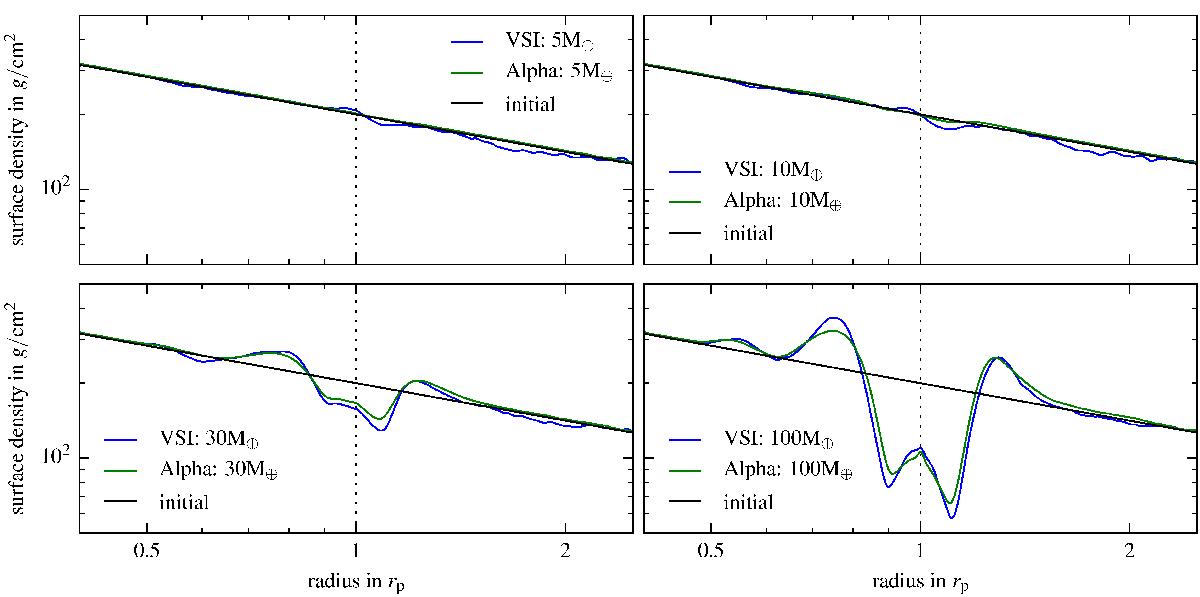
Surface density for the different simulations after 200 orbits. The vertical dotted black lines indicate the position of the planet and the initial surface density profile is marked by the solid black line. For each planet mass the VSI models are compared to the α-disc cases.
Current usage metrics show cumulative count of Article Views (full-text article views including HTML views, PDF and ePub downloads, according to the available data) and Abstracts Views on Vision4Press platform.
Data correspond to usage on the plateform after 2015. The current usage metrics is available 48-96 hours after online publication and is updated daily on week days.
Initial download of the metrics may take a while.