Fig. 7
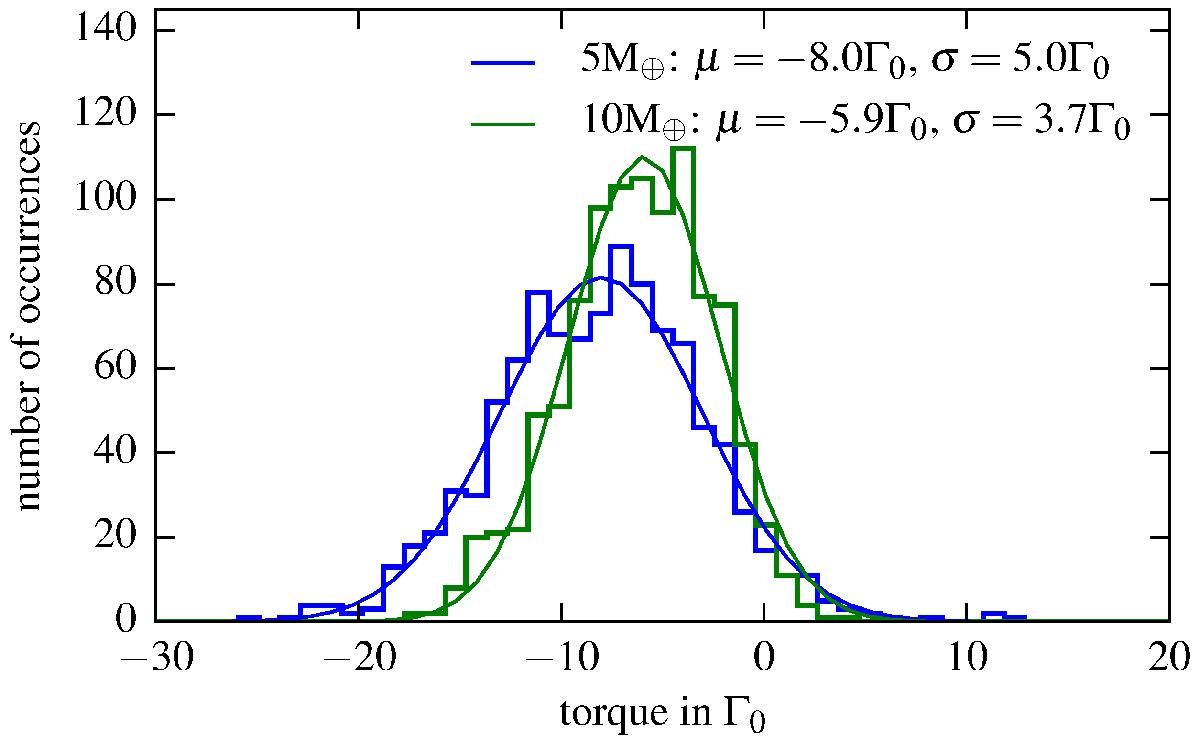
Histogram taken over 1000 samples of the occurrence of certain torque values for the two low mass planets in the VSI turbulent disc. The data were collected for the last 100 orbits of the simulations. The torques are normalised to Γ0 in each case and the average values and standard deviation over this time span are quoted in legend.
Current usage metrics show cumulative count of Article Views (full-text article views including HTML views, PDF and ePub downloads, according to the available data) and Abstracts Views on Vision4Press platform.
Data correspond to usage on the plateform after 2015. The current usage metrics is available 48-96 hours after online publication and is updated daily on week days.
Initial download of the metrics may take a while.