Fig. 1
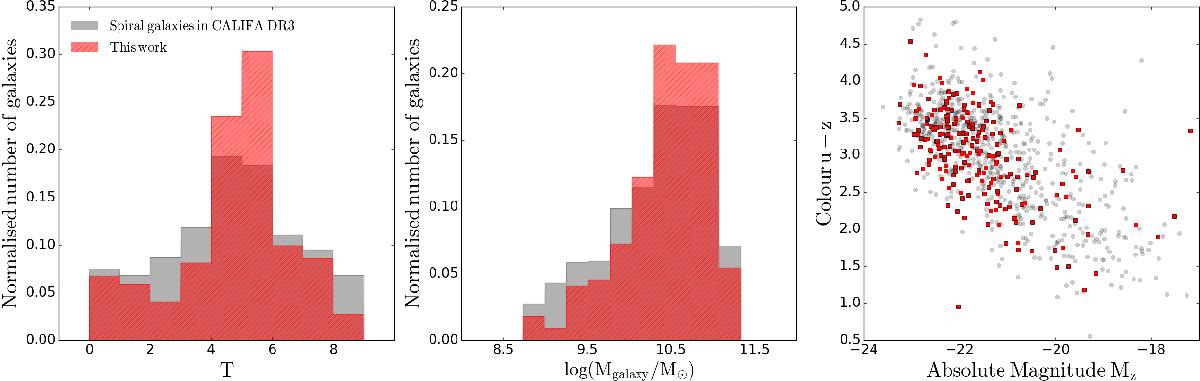
Characterisation of the sample of galaxies under analysis in this work (red) compared to the CALIFA DR3 sample of galaxies limited to spiral systems (grey). Left-hand panel: distribution is indicated of the morphological types according to the T parameter from Walcher et al. (2014). Middle panel: distribution is indicated of stellar masses from Walcher et al. (2014). Right-hand panel: distribution is indicated of the galaxies in the (u − z) – Mz colour magnitude diagram.
Current usage metrics show cumulative count of Article Views (full-text article views including HTML views, PDF and ePub downloads, according to the available data) and Abstracts Views on Vision4Press platform.
Data correspond to usage on the plateform after 2015. The current usage metrics is available 48-96 hours after online publication and is updated daily on week days.
Initial download of the metrics may take a while.