Fig. 2
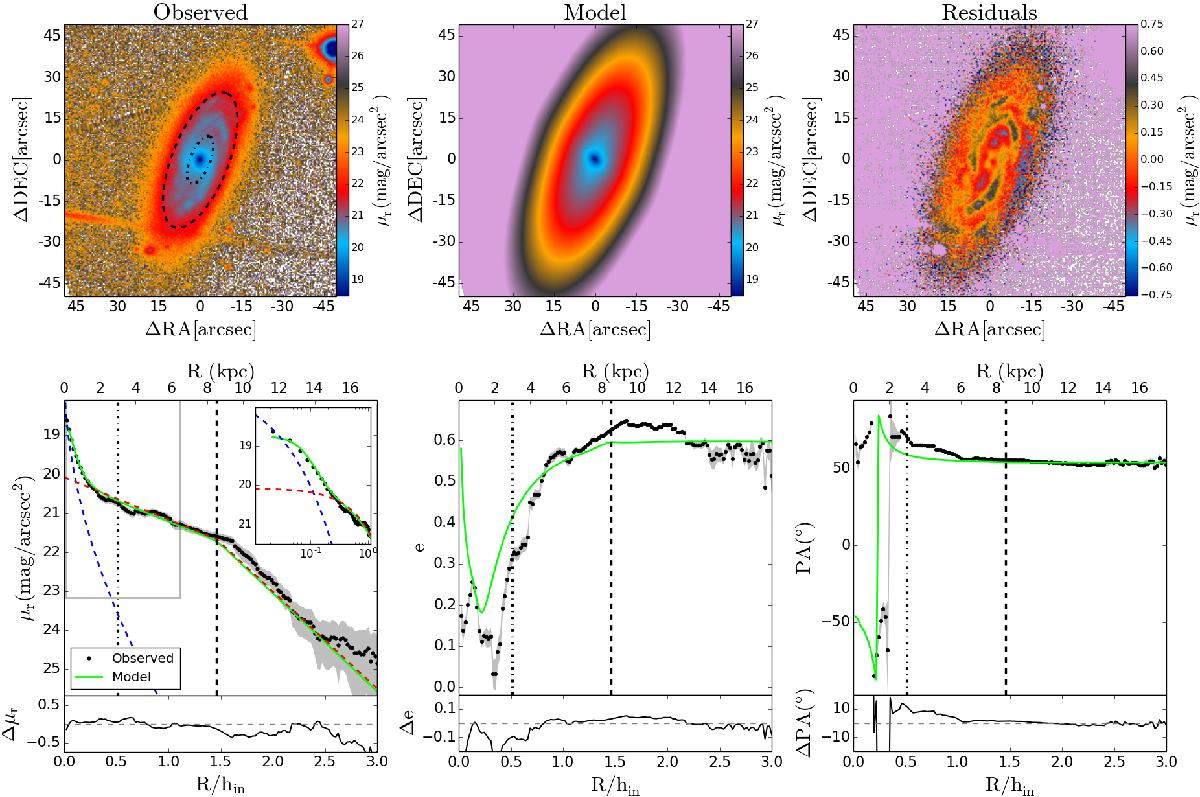
Plots summarising the 2D decomposition for IC 1199. Top left: r-band SDSS image is shown. Top middle: galaxy model derived from GASP2D fit considering a bulge and a broken disc component is shown. Top right: residuals image derived by subtracting the observed image to the model is shown. North is up in all these images. Bottom left: the SDSS r-band surface brightness profile is shown. Bottom middle: the ellipticity profile is shown. Bottom right: the position angle profile is shown. In bottom panels: points represent the observed magnitude; shadow areas account for the errors, computed as one sigma of the distribution of values within the ellipse; red dashed line is the broken disc model; blue dashed line follows the bulge light distribution; light green line is the output of ellipse applied to the model; and the inset in bottom left panel is focused on the inner part with a logarithmic radial scale. All bottom panel plots show an auxiliary plot below with the residuals between observed and model values. Dot-dashed vertical lines and the dot-dashed ellipse delimit the bulge-dominated region. Dashed vertical lines and the dashed ellipse are located at the break radius.
Current usage metrics show cumulative count of Article Views (full-text article views including HTML views, PDF and ePub downloads, according to the available data) and Abstracts Views on Vision4Press platform.
Data correspond to usage on the plateform after 2015. The current usage metrics is available 48-96 hours after online publication and is updated daily on week days.
Initial download of the metrics may take a while.