Fig. 4
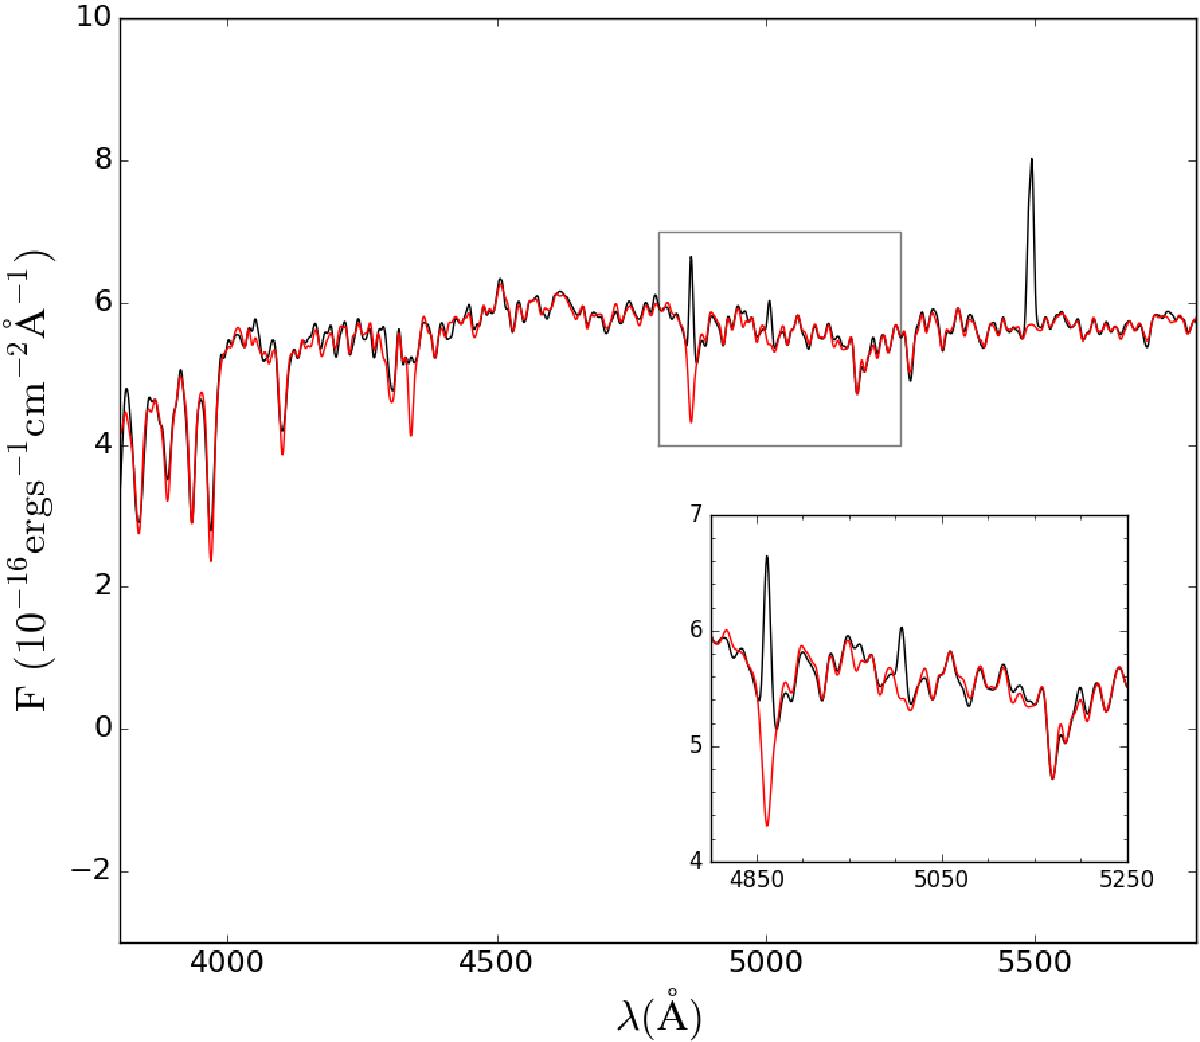
Example of a typical CALIFA spectrum analysed with the described method. In particular, this is the spectrum of IC 1199 at 24 arcsecs (1.34 hin). The solid black line represents the observed, rest-framed spectrum. The solid red line is the STECKMAP best fit to the observed spectrum after removing the gaseous emission lines with GANDALF. The inset is focused on the Hβ-Mg I (4800–5250 Å). See text for further details.
Current usage metrics show cumulative count of Article Views (full-text article views including HTML views, PDF and ePub downloads, according to the available data) and Abstracts Views on Vision4Press platform.
Data correspond to usage on the plateform after 2015. The current usage metrics is available 48-96 hours after online publication and is updated daily on week days.
Initial download of the metrics may take a while.