Fig. 5
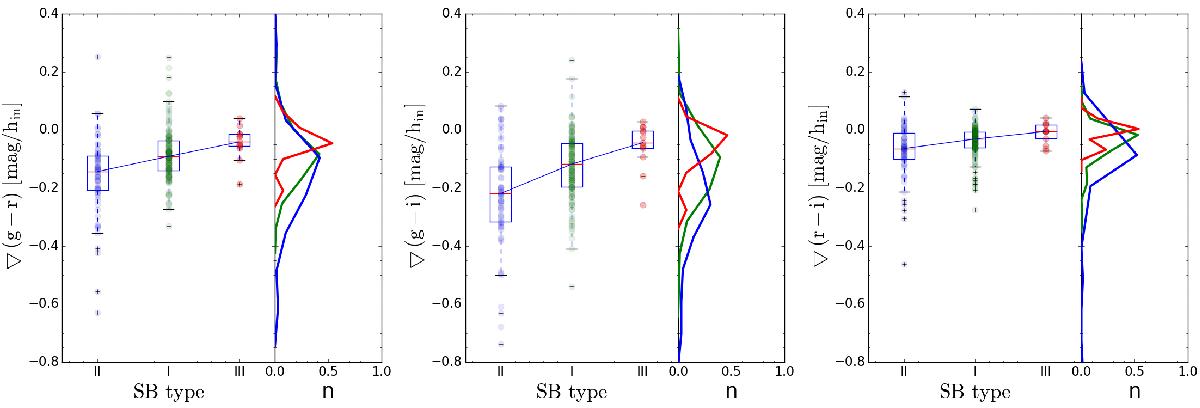
Distribution of the inner g − r (left), g − i (middle), and r − i (right) colour gradients as a function of the surface brightness profiles of the galaxies represented as box plots. The boxes extend from the lower to upper quartile values of the gradient distributions with a red line at the median. The whiskers extend from the box to show the range of the data. Outlier points are those past the end of the whiskers and are represented with crosses. We also show the histograms for each distribution colour coded according to the SB type: type I (green), type II (blue), and type III (red). Dots with transparency represent all the observational values. The median values of all the distributions are linked using a blue line to highlight the tendency.
Current usage metrics show cumulative count of Article Views (full-text article views including HTML views, PDF and ePub downloads, according to the available data) and Abstracts Views on Vision4Press platform.
Data correspond to usage on the plateform after 2015. The current usage metrics is available 48-96 hours after online publication and is updated daily on week days.
Initial download of the metrics may take a while.