Fig. 3
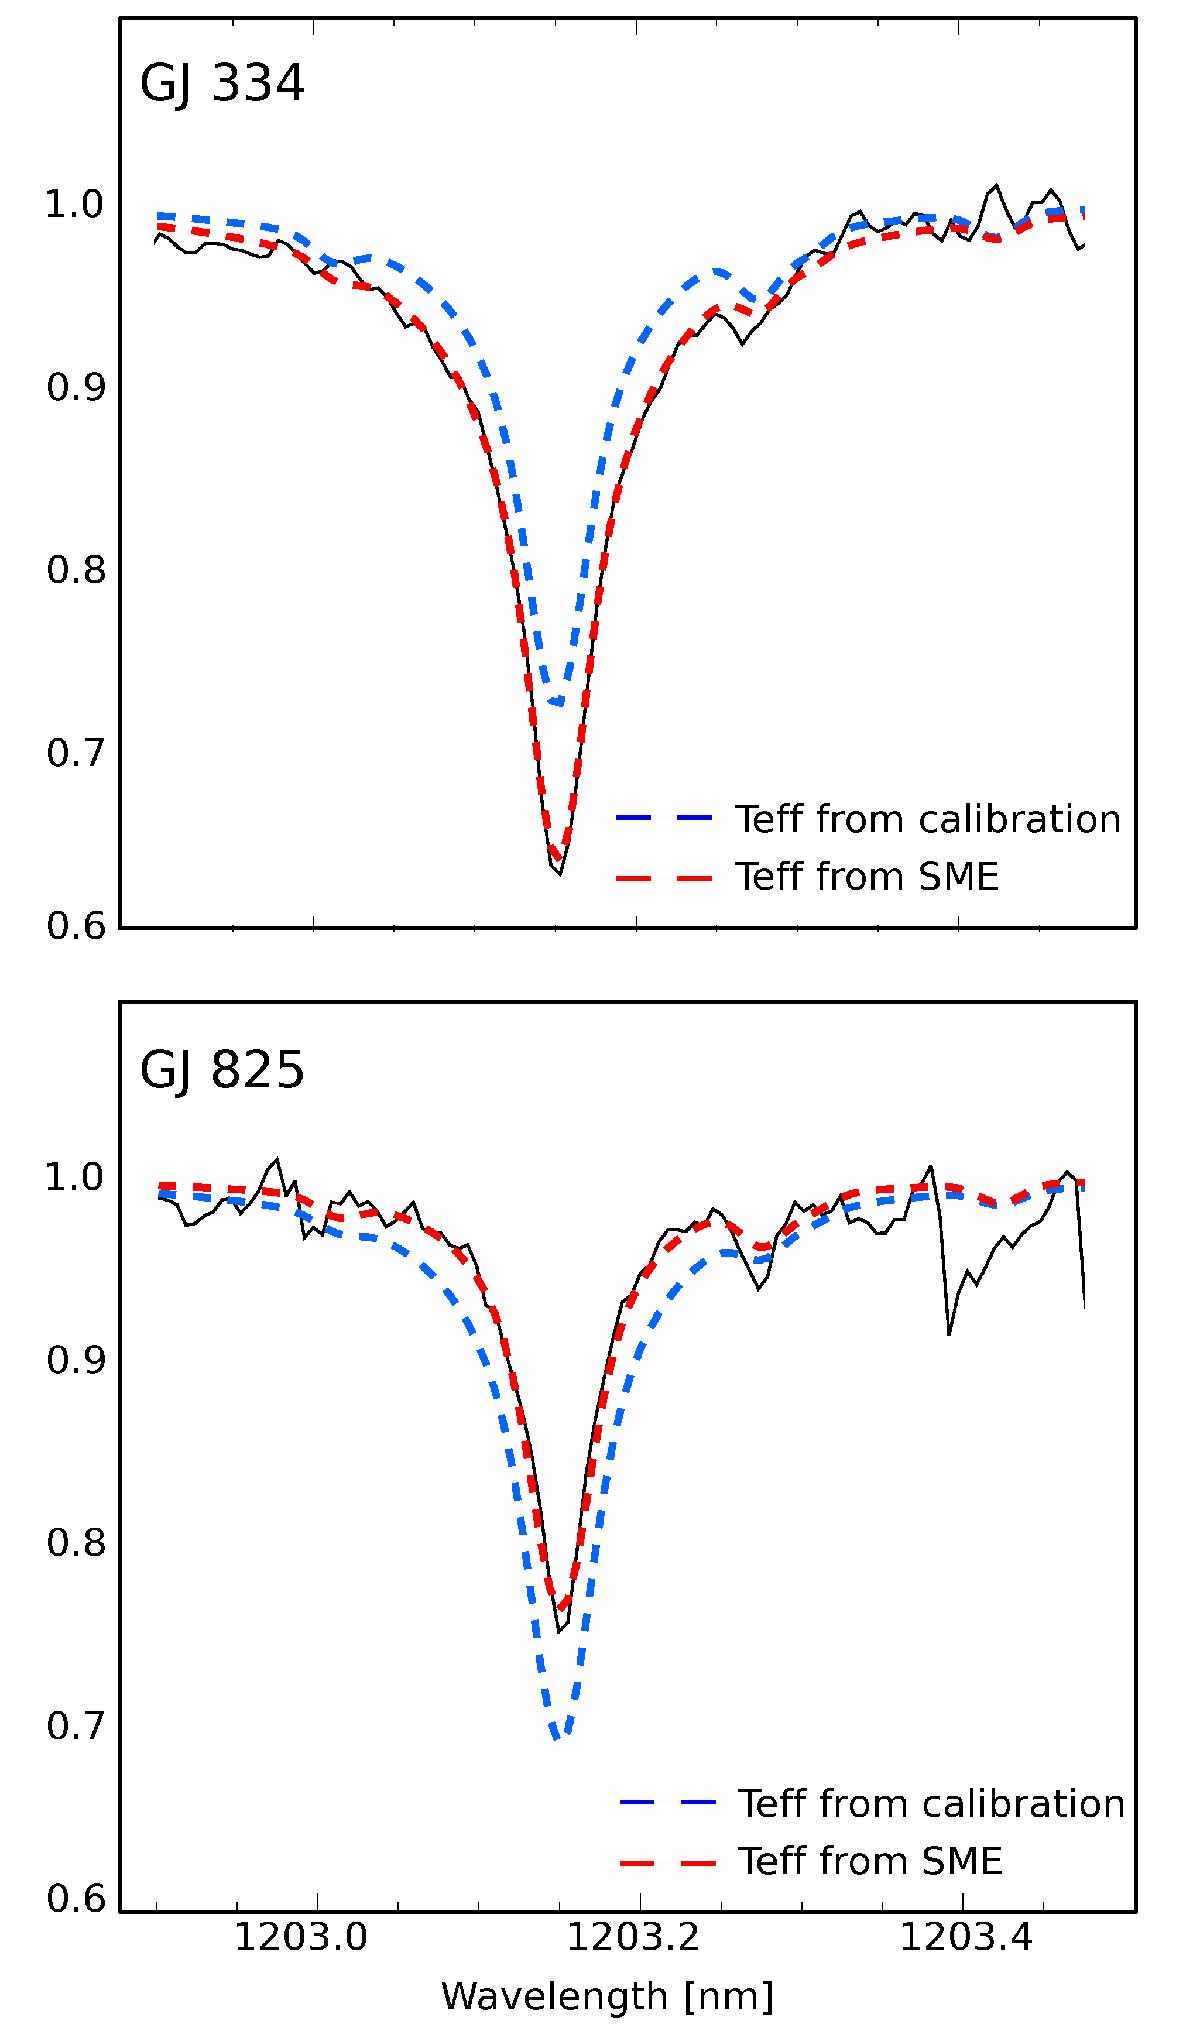
Wavelength interval around the Si line at 1203.15 nm for targets GJ 334 and GJ 825. The observed spectrum is shown with the solid black line, and calculated synthetic spectra at two different temperatures at best-fit metallicity are shown as dashed lines. The blue spectrum is calculated at the temperature given by the empirical calibration by M15, while the red spectrum results from letting SME simultaneously vary the effective temperature, metallicity, and macroturbulence.
Current usage metrics show cumulative count of Article Views (full-text article views including HTML views, PDF and ePub downloads, according to the available data) and Abstracts Views on Vision4Press platform.
Data correspond to usage on the plateform after 2015. The current usage metrics is available 48-96 hours after online publication and is updated daily on week days.
Initial download of the metrics may take a while.