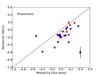
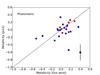
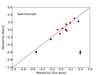
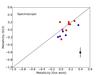
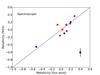
Fig. 6
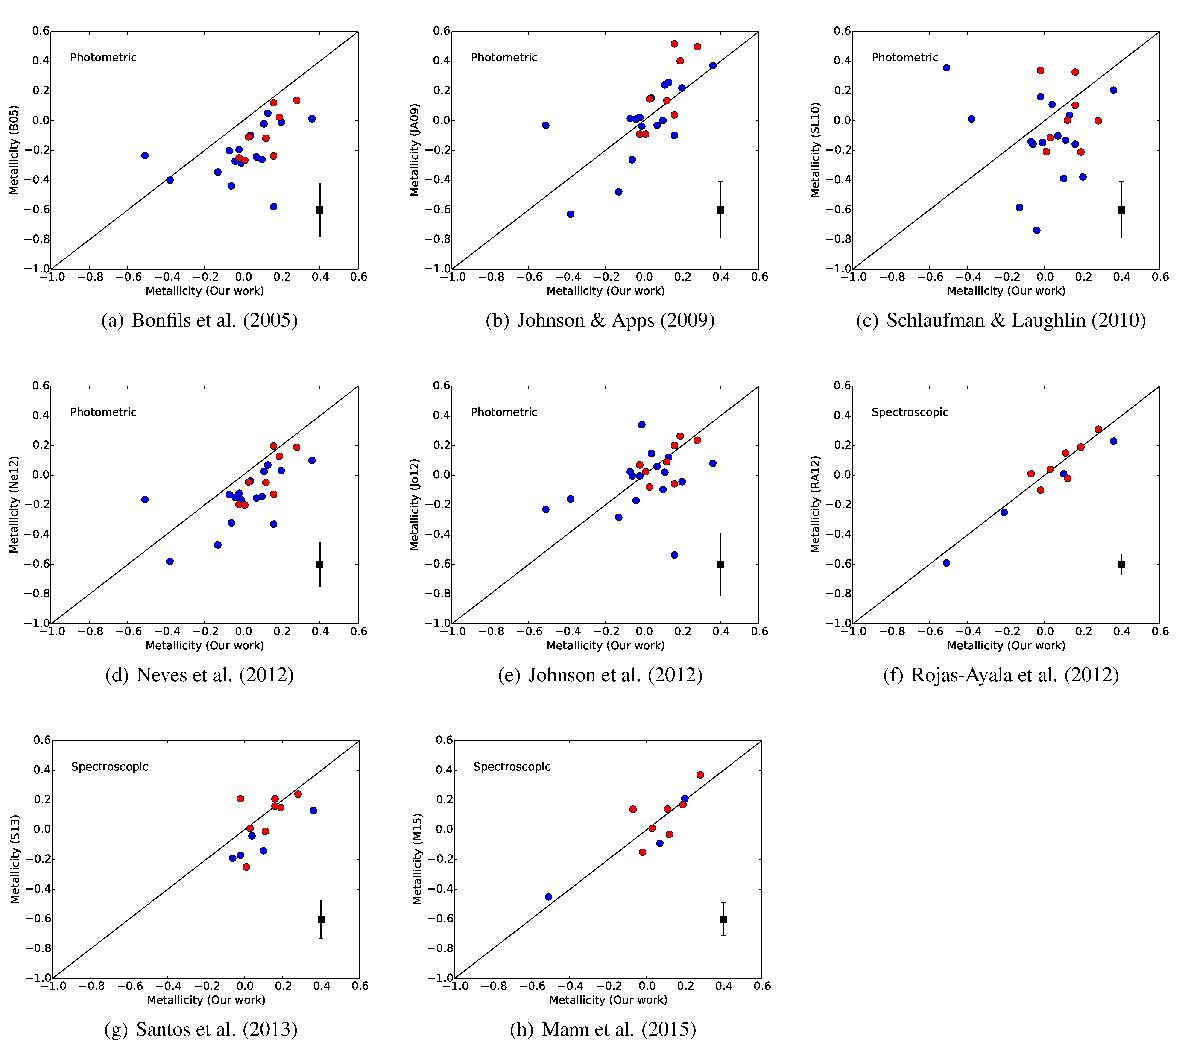
Comparison of the metallicity values determined by five photometric calibrations (Bonfils et al. 2005; Schlaufman & Laughlin 2010; Neves et al. 2012; Johnson & Apps 2009; Johnson et al. 2012) and relevant spectroscopic work (Rojas-Ayala et al. 2012; Santos et al. 2013; M15). The black lines show a one-to-one relationship, the blue points indicate the metallicity values from this paper, and the red points indicate published results from L16. The numerical value of the average difference of our result compared to each calibration is given in the text in Sect. 4.2. The error bars show the standard deviation of the differences between the metallicities of each of the literature methods and our work.
Current usage metrics show cumulative count of Article Views (full-text article views including HTML views, PDF and ePub downloads, according to the available data) and Abstracts Views on Vision4Press platform.
Data correspond to usage on the plateform after 2015. The current usage metrics is available 48-96 hours after online publication and is updated daily on week days.
Initial download of the metrics may take a while.