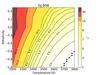
Fig. A.1
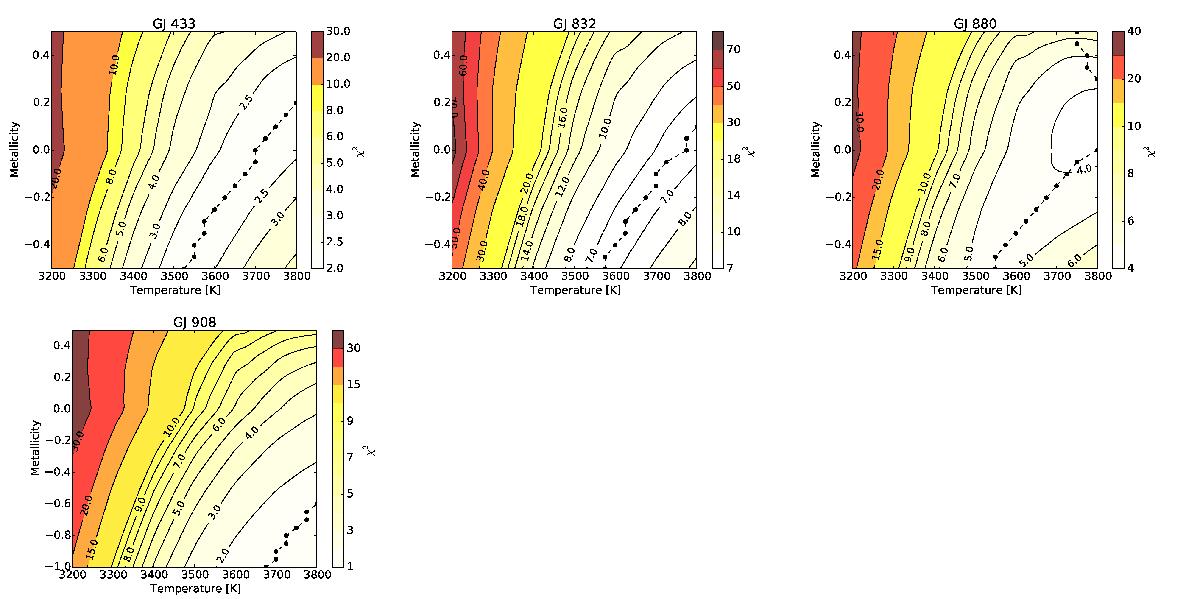
Demonstration of FeH line strength dependency on the effective temperature and overall metallicity. The contour plots in this figure show the calculated χ2 of the fit based on a grid of metallicity and effective temperature of the stars with spectral type M1.5. The connected dots indicate the temperature with the minimum χ2 for each step in metallicity. The range for metallically is larger for GJ 908 than the remaining targets.
Current usage metrics show cumulative count of Article Views (full-text article views including HTML views, PDF and ePub downloads, according to the available data) and Abstracts Views on Vision4Press platform.
Data correspond to usage on the plateform after 2015. The current usage metrics is available 48-96 hours after online publication and is updated daily on week days.
Initial download of the metrics may take a while.