Fig. 12
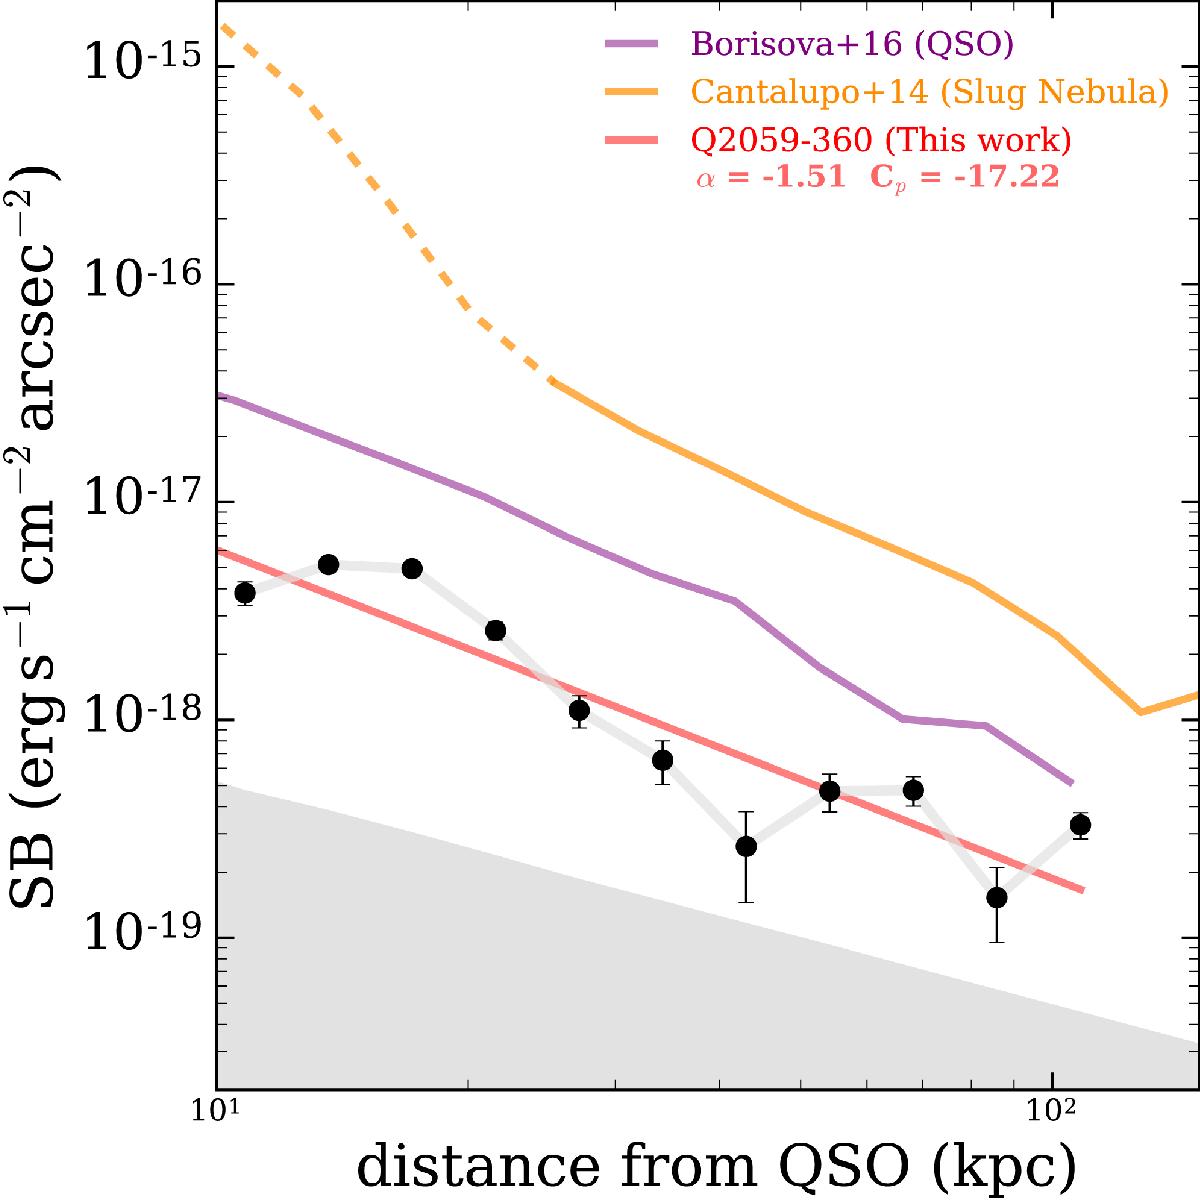
Radial variation of the SB of the LAB (black dots; distance in physical kpc). The red line is a least-squares fit of a power law to the data. The average profile of the 17 nebulae associated with radio-quiet QSOs (B16) is shown as a purple line. The yellow line represents the Slug Nebula (Cantalupo et al. 2014), the dashed part of it is polluted by the QSO light. Correcting the observed SB for redshift dimming would bring the yellow curve very close to the purple curve, but would slightly increase the distance between the red and purple curves. The upper limit of the gray area corresponds to the 2σ noise on the profile.
Current usage metrics show cumulative count of Article Views (full-text article views including HTML views, PDF and ePub downloads, according to the available data) and Abstracts Views on Vision4Press platform.
Data correspond to usage on the plateform after 2015. The current usage metrics is available 48-96 hours after online publication and is updated daily on week days.
Initial download of the metrics may take a while.