Fig. 1
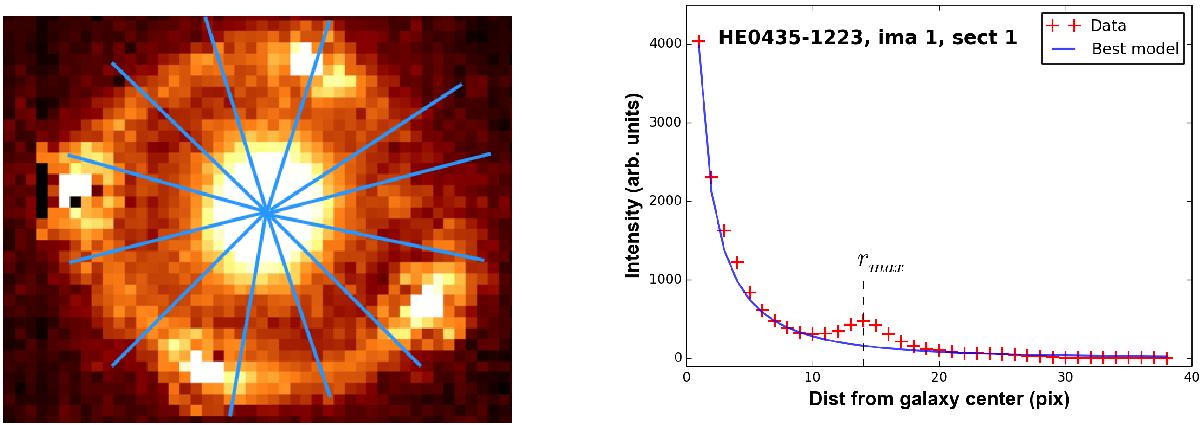
Left: sketch of the division of an image of HE0435-1223 into sectors along the angular coordinates. Right: collapsed radial profile of a sector from HE0435-1223. The crosses represent the measured intensity along the radial coordinate. The solid line shows the best-fitting de Vaucouleurs profile regarding the residuals maximum symmetry criterion.
Current usage metrics show cumulative count of Article Views (full-text article views including HTML views, PDF and ePub downloads, according to the available data) and Abstracts Views on Vision4Press platform.
Data correspond to usage on the plateform after 2015. The current usage metrics is available 48-96 hours after online publication and is updated daily on week days.
Initial download of the metrics may take a while.