Fig. 4
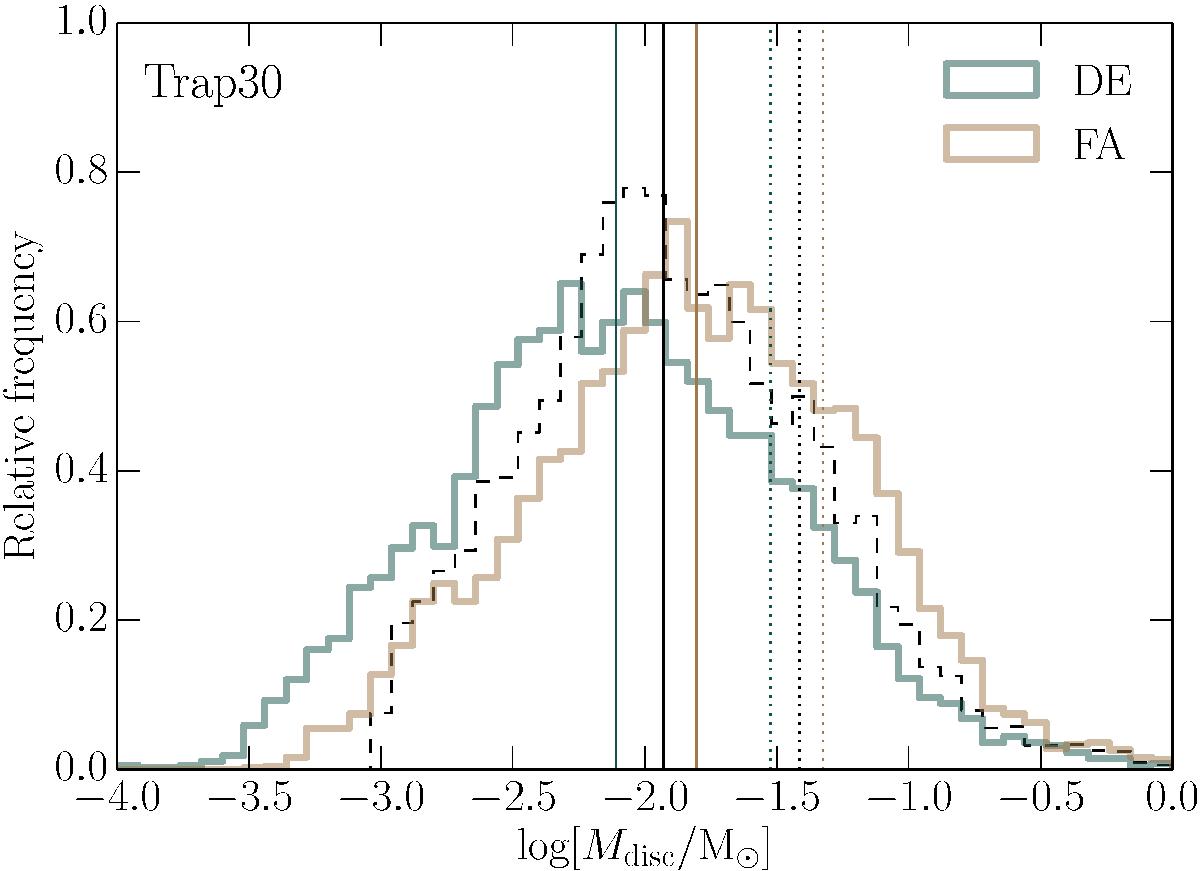
Relative distribution of disc masses at the end of our Trap30 simulations. Colours correspond to the previous figures. The initial disc mass distribution is shown in black dashed bins. The distribution is based on all the disc masses in the ten simulations we have performed with these parameters. The solid vertical lines in the corresponding colour indicate the median disc mass and the vertical dotted lines indicate the mean disc mass.
Current usage metrics show cumulative count of Article Views (full-text article views including HTML views, PDF and ePub downloads, according to the available data) and Abstracts Views on Vision4Press platform.
Data correspond to usage on the plateform after 2015. The current usage metrics is available 48-96 hours after online publication and is updated daily on week days.
Initial download of the metrics may take a while.