Fig. 1
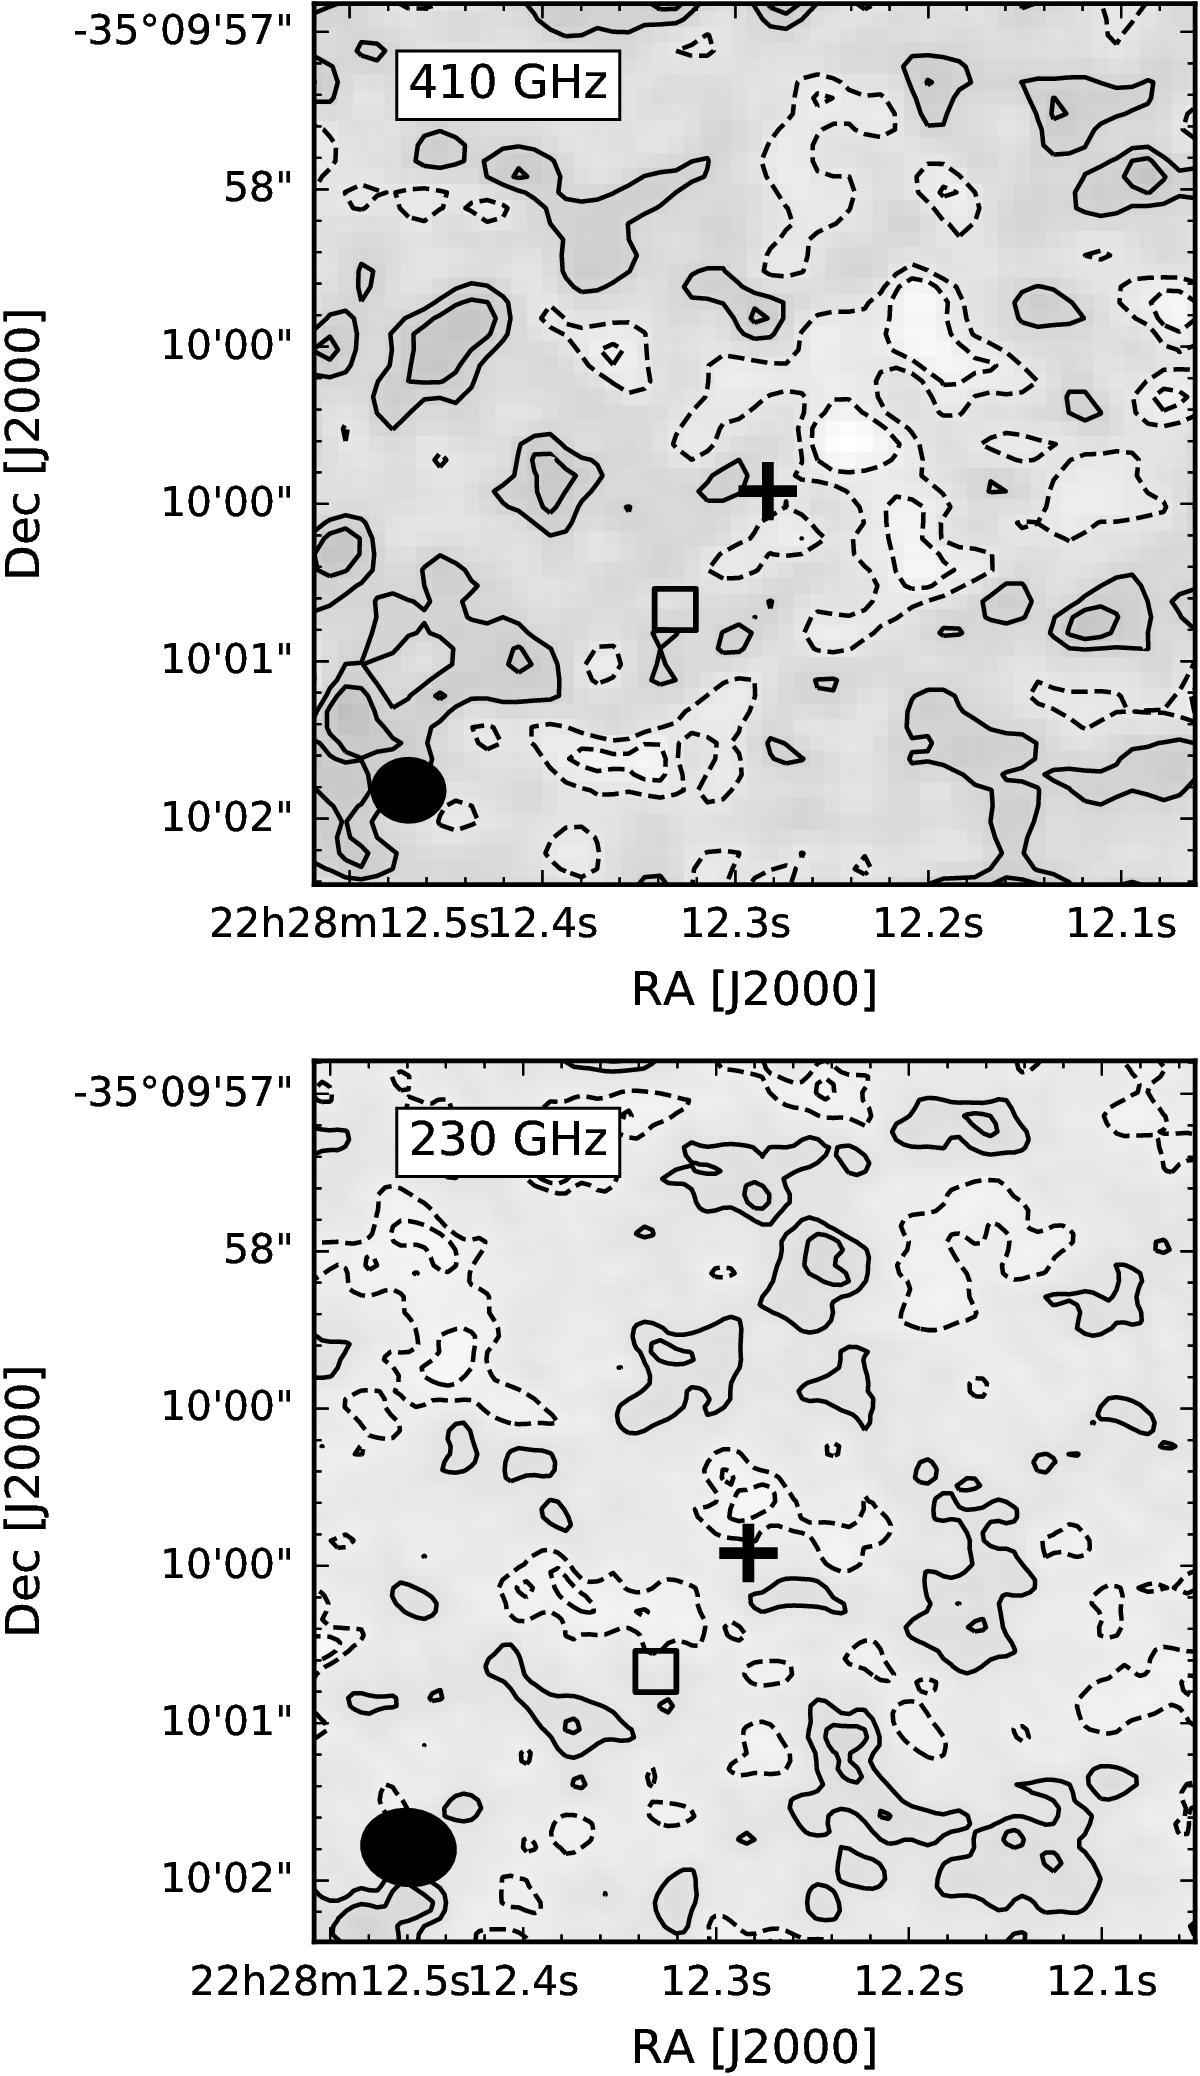
ALMA continuum map in band 8 (410 GHz; top) and in Band 6 (230 GHz, bottom). Black solid contours are at levels of 1 and 2σ, where i.e σ = 40μJy/beam and σ = 7μJy/beam in the two bands, respectively. Dashed contours trace negative levels at –1 and –2σ. The synthesised beams are shown in the bottom left corners. The position of BDF-3299 measured in the HST Y-band is marked with a cross. The square mark shows the location of the [C ii] detection.
Current usage metrics show cumulative count of Article Views (full-text article views including HTML views, PDF and ePub downloads, according to the available data) and Abstracts Views on Vision4Press platform.
Data correspond to usage on the plateform after 2015. The current usage metrics is available 48-96 hours after online publication and is updated daily on week days.
Initial download of the metrics may take a while.