Fig. 3
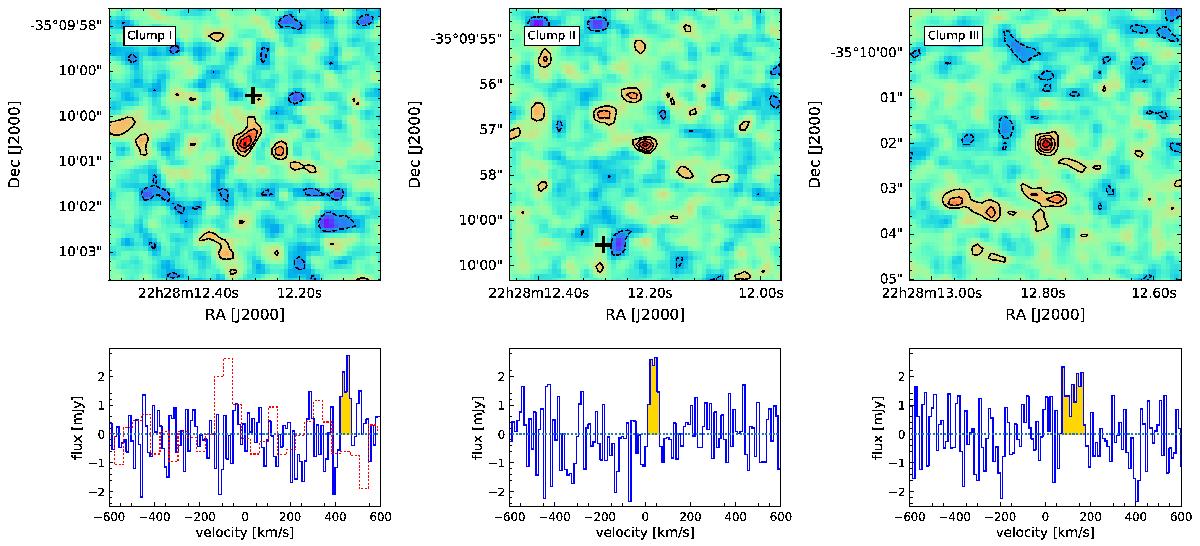
The top panels show the flux maps of the three [O iii] detections, clump-I, -II, and -III (from left to right). Black contours show emission at levels of 2, 3, 4 and 5σ. The location of the BDF-3299 galaxy is marked as a black cross (in the third panel the mark is outside of the field of view). The bottom panels show the spectra of the line emitters at a spectral resolution of 10 km s-1. The yellow shaded region shows the region used to integrate the flux to obtain the maps in the upper panels. Velocities are relative to the Lyα peak of BDF-3299. The red dotted spectrum in the left panel show the [CII] spectrum shown in Fig. 2 and scaled arbitrarily up in flux density for comparison.
Current usage metrics show cumulative count of Article Views (full-text article views including HTML views, PDF and ePub downloads, according to the available data) and Abstracts Views on Vision4Press platform.
Data correspond to usage on the plateform after 2015. The current usage metrics is available 48-96 hours after online publication and is updated daily on week days.
Initial download of the metrics may take a while.