Fig. 4
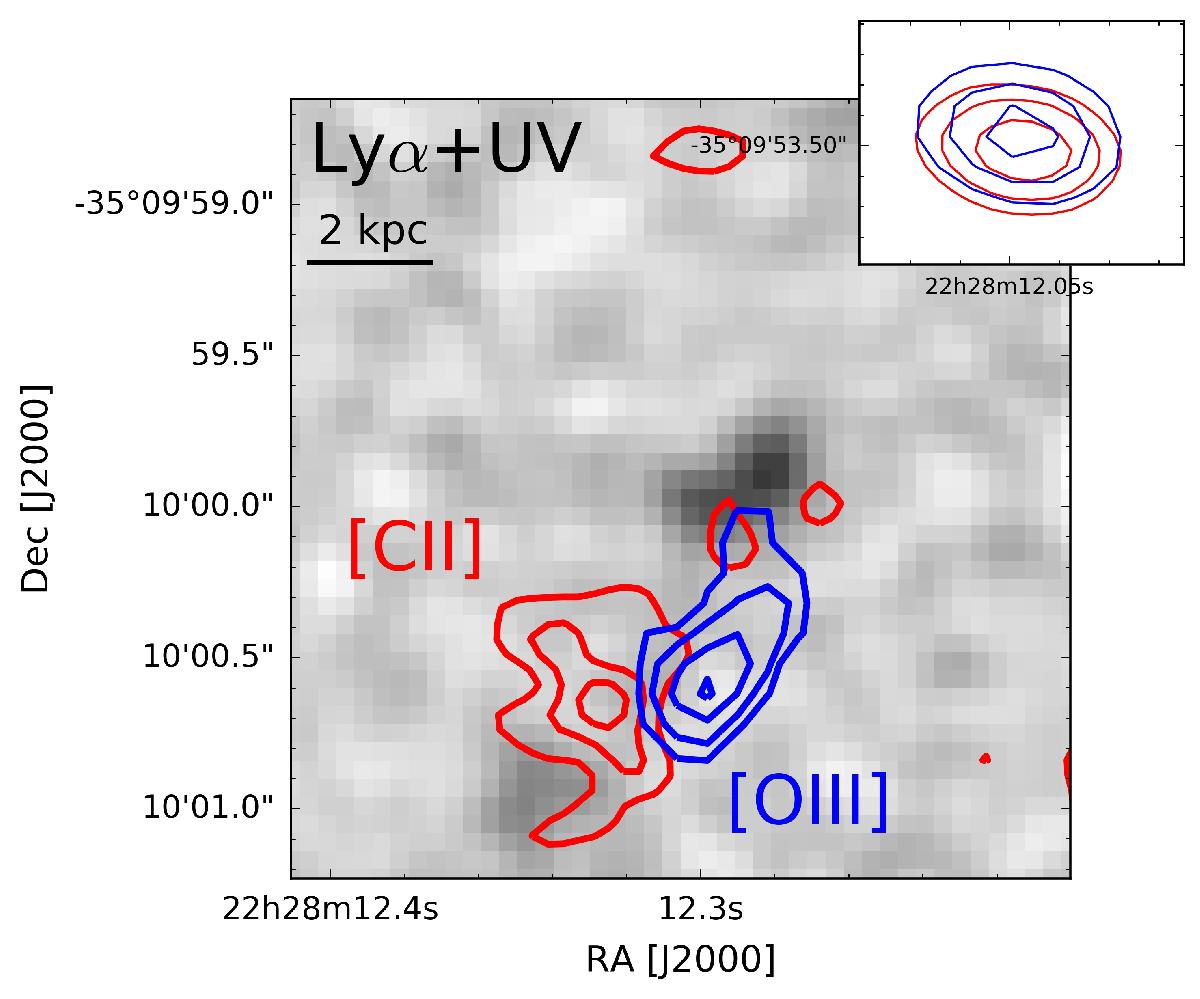
The HST Y-band image of the BDF-3299 field is shown in the background in grey scale. The blue contours show the [O iii] map of clump-I. The red contours show the [C ii] emission. In both maps the contours are at levels of 2, 3, and 4σ. Since the emission is resolved in both cases, the peak emission is not representative of the significance of the emission when extracted from the entire emission region. The inset shows in blue and red contours the continuum emission of the bright serendipitous source at North-West in Band-6 and -8, respectively, showing that the astrometry in Band-8 is consistent within the error (0.1′′) with the astrometry in Band-6.
Current usage metrics show cumulative count of Article Views (full-text article views including HTML views, PDF and ePub downloads, according to the available data) and Abstracts Views on Vision4Press platform.
Data correspond to usage on the plateform after 2015. The current usage metrics is available 48-96 hours after online publication and is updated daily on week days.
Initial download of the metrics may take a while.