Fig. 6
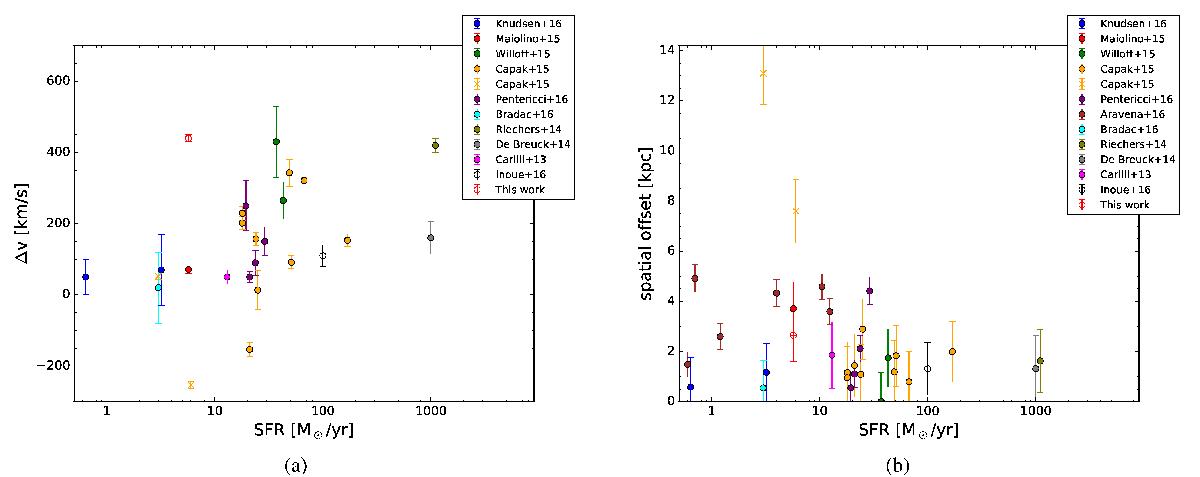
Spectral (a) and spatial (b) offsets between the far-IR fine structure lines and the optical/UV tracers in high redshift galaxies galaxies, from the literature. The filled circles are estimated from [C ii] emission obtained from Maiolino et al. (2015), Willott et al. (2015), Capak et al. (2015), Knudsen et al. (2016), Pentericci et al. (2016), Aravena et al. (2016), while the open ones denote the spectral and spatial offsets revealed from [O iii] detections (this work and Inoue et al. 2016). The orange cross symbols indicates the offsets of two sources (HZ5a and HZ8W; Capak et al. 2015) for which the association between [C ii] and the optical galaxy is uncertain.
Current usage metrics show cumulative count of Article Views (full-text article views including HTML views, PDF and ePub downloads, according to the available data) and Abstracts Views on Vision4Press platform.
Data correspond to usage on the plateform after 2015. The current usage metrics is available 48-96 hours after online publication and is updated daily on week days.
Initial download of the metrics may take a while.