Fig. 7
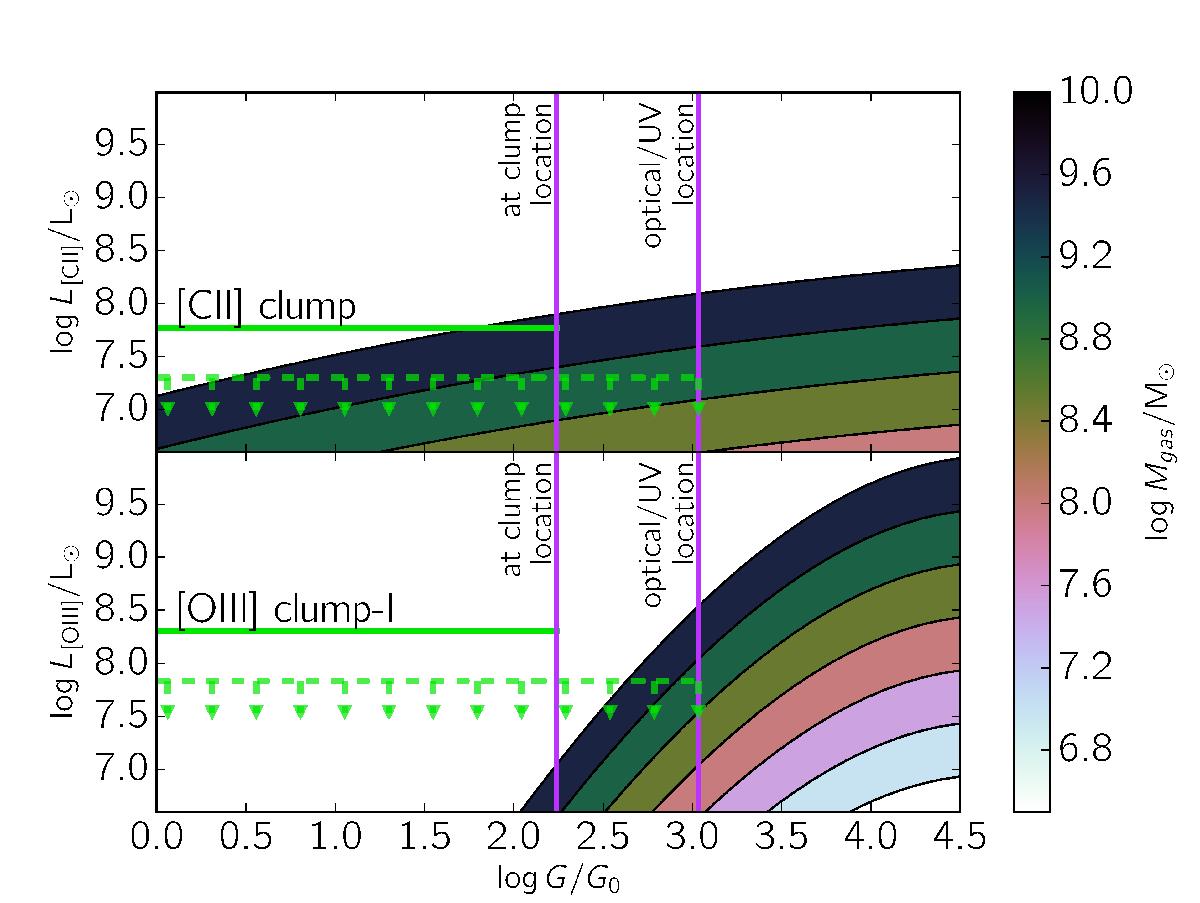
Predicted [C ii] (upper panel) and [O iii] (lower panel) luminosities (L) as a function of the incident flux (G) exciting the line, inferred by using the model presented in V16, in which the colour shading is done according to Mgas, as encoded in the colourbar. In each panel we plot with a horizontal green line the luminosity inferred from our observations of the [C ii] clump and of the [O iii] clump-I. The horizontal dashed green lines show the upper limits at the location of the Y-band image of BDF-3299. Additionally, we show the flux G expected from BDF-3299 at the location of the [C ii] and [O iii] clumps and also the estimated average G within the galaxy BDF-3299. See the text for details.
Current usage metrics show cumulative count of Article Views (full-text article views including HTML views, PDF and ePub downloads, according to the available data) and Abstracts Views on Vision4Press platform.
Data correspond to usage on the plateform after 2015. The current usage metrics is available 48-96 hours after online publication and is updated daily on week days.
Initial download of the metrics may take a while.